
A Lot Has To Go Right For Tech Bulls Who Are Hoping For Short Squeeze Of Non-Commercials
Short squeeze of non-commercials in the futures market was a big factor behind the rally in the S&P 500 since mid-June. These traders have now targeted the Nasdaq 100. This has raised tech bulls’ hopes for a squeeze. But conditions may be a little different this time around. (SPX, NDX)
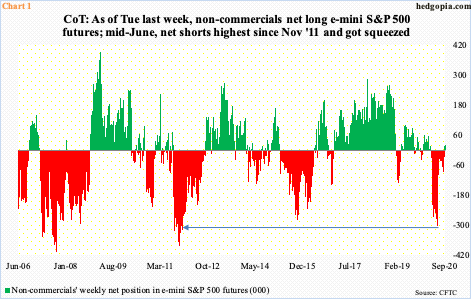
Three months ago, after a brief selloff, bulls and bears wrestled for control of the 200-day moving average on the S&P 500 large cap index. In the futures market, non-commercials were convinced the tug of war would resolve with a breakdown. They built up 303,305 net shorts in e-mini S&P 500 futures – the highest since November 2011 (Chart 1).
When it was all said and done, after several tests of the 200-day in June, S&P 500 bulls came out on top. The rally that followed peaked on the 2nd this month, with full cooperation from non-commercials who were forced to cover. By the week to September 1, net shorts had dwindled to 25,616 contracts. Last week, they were net long 21,491 contracts.
This was an epic short squeeze. From 2999.74 on June 29 to 3588.11 on the 2nd this month, the S&P 500 rallied just under 20 percent.
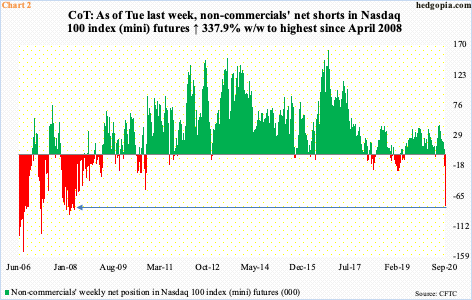
Equity bulls are hoping for a similar squeeze – only this time in Nasdaq 100 index (mini) futures. In the week to September 8, for the first time in 16 weeks, non-commercials switched to net short. In the subsequent week, which was the week to last Tuesday, they went aggressive. The tally of 80,871 net shorts is the highest since April 2008 (Chart 2).
Interestingly, in the week to June 30, these traders were net long 43,819 contracts, followed by 44,700 in the week to July 7. As did the S&P 500, the Nasdaq 100 was getting ready to launch into another leg higher. On June 29, tech bulls defended the prior all-time high from February and the index catapulted higher. But non-commercials never bought into this, as they gradually reduced their net longs, before getting net short the last two weeks.
The sizable buildup in net shorts has raised tech bulls’ squeeze hopes.
First of all, just because net shorts are high, it does not have to always result in a squeeze right away. In 2006-2008, non-commercials’ net shorts in Nasdaq 100 index (mini) futures persisted for quite some time. Since these traders thought it worthwhile to cut back their net longs in late June/early July, a comparative look into how things were back then versus now can help.
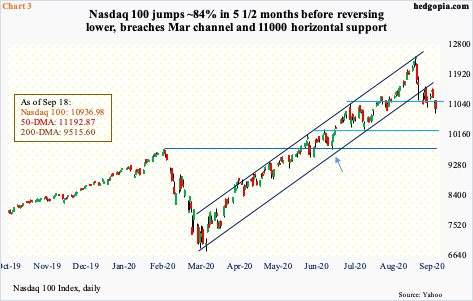
As mentioned previously, the Nasdaq 100 on June 29 bottom-ticked 9742.89 (arrow in Chart 3). That low was bought. On February 19, the index had top-ticked 9736.57 before suffering a nasty decline through March 23. A successful test of the February high gave the Nasdaq 100 another boost. Throughout this, the index was above both the 50- and 200-day. Both averages were rising. This was also true with the 10- and 20-day.
Now, the 50-day (11192.87) is flattish and was lost last Thursday. A rising channel from the March low is breached, as is horizontal support at 11000. On Tuesday and Wednesday last week, rally attempts got rejected at the sharply dropping 10-day, which has already crossed down the 20-day. In short, right here and now, bears have the upper hand. All this preceded an 84 percent surge from the March low.
Nearest support lies at 10300-10400. Even after the 12.1-percent decline from the September 2nd high, the 200-day is 13 percent away.
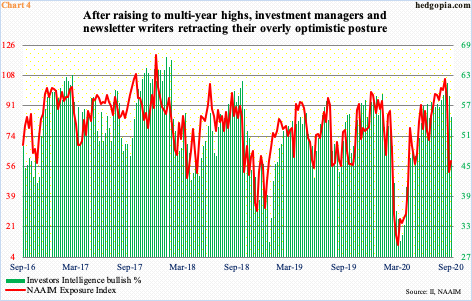
Early June, the NAAIM Exposure Index, which represents National Association of Active Investment Managers members’ average exposure to US equity markets, hit 91.6, before dropping to 71.5 by the end of the month. This was when the Nasdaq 100 bottomed, and these pros, who manage money for a living, shifted up. By the week to August 25, the Exposure Index hit 106.6, which was the fourth highest reading in its 14-year history (Chart 4), staying north of 100 for three straight weeks. They began cutting back exposure to US stocks in the week to September 1; incidentally, the Nasdaq 100, along with other major indices, peaked on the 2nd. Last week, the Exposure Index read 59.3, up 6.2 from the prior week. A lot of the froth has been taken care of, but these managers are probably not done unwinding their formerly overly bullish posture.
Elsewhere, on the retail front, Investors Intelligence bulls last week dropped 4.2 percentage points week-over-week to 54.8 percent, essentially on par with 54.5 percent on the week to June 30. In between, the survey of newsletter writers hit 61.5 percent in the week to September 1, which was the highest since October 2018. Despite the two-week drop, sentiment remains elevated.
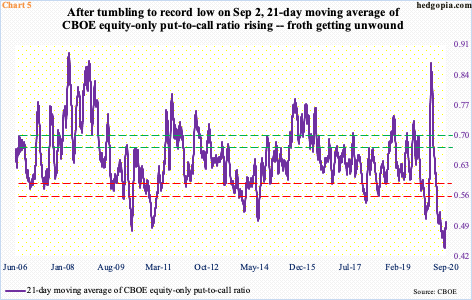
In the options market, the 21-day moving average of the CBOE equity-only put-to-call ratio surged to 0.867 on March 20, one trading session before stocks bottomed on the 23rd. Fear was rampant back then. This needed to unwind and unwind it did. By late June, the ratio was down to 0.513, which historically already reflected elevated investor optimism (Chart 5). Right there and then, major indices began another leg higher. The ratio kept going lower, as purchases of calls far superseded that of puts. On the 2nd this month when equity indices such as the Nasdaq 100 peaked, the ratio hit 0.439 – a new low.
As stocks have come under pressure since that peak, the ratio has risen, to 0.50 as of last Friday. But this metric has a ways to go before the built-in greed is taken care of. If past is prelude, it can rise to low- to mid-0.70s before that happens.
Back when stocks bottomed on March 23, the Fed played a major role. It was on that day the central bank announced unlimited quantitative easing (QE) and said it would begin to buy investment-grade corporate bonds, which on April 9 was extended to also include high-yield bonds.
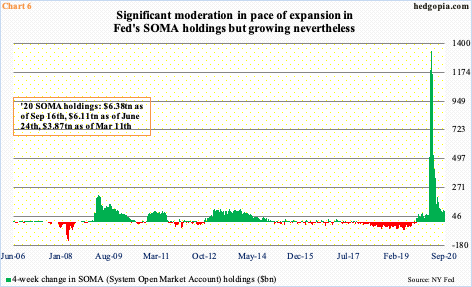
In the week to March 25, SOMA (System Open Market Account) holdings were $4.34 trillion, of which Treasury notes and bonds were $2.44 trillion and mortgage-backed securities $1.38 trillion. As of last Wednesday, they respectively stood at $6.38 trillion, $3.74 trillion and $2 trillion.
Chart 6 highlights the week-over-week change in these assets. The deceleration in the pace of expansion is evident – from $1.34 trillion in the week to April 13 to $155.6 billion in the week to June 29 to $86.2 billion last week. Equity bulls are not enthralled by this. SOMA holdings have grown by under $100 billion a week the past seven weeks. They would like this to reaccelerate. In last week’s FOMC meeting, the Fed did not signal that this was imminent.
Even though the Fed has implicitly guaranteed a backstop to stocks, the threshold is an open question – is it stocks down 10 percent, 15 percent or any other number? In February-March, the S&P 500 tumbled 35 percent and the Nasdaq 100 30 percent before the Fed acted.
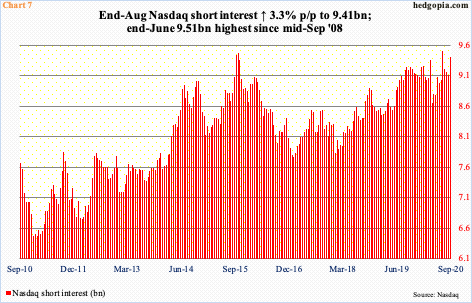
In the event tech bulls put foot down, besides the afore-mentioned non-commercials’ net shorts, Nasdaq short interest is another data point that can lend them a helping hand.
At the end of August, short interest rose 3.3 percent period-over-period to 9.4 billion (Chart 7), which is not that far away from 9.5 billion at the end of June, which was the highest since mid-September 2008. As the Nasdaq bottomed in late June, shorts were forced to cut back, reducing short interest to 9.1 billion. In the latest period, they went aggressive again. A squeeze obviously will provide a tailwind to the index, but, right here and now, odds probably favor the shorts – duration and magnitude notwithstanding.
The wildcard here is the White House. President Trump does not like stocks to go down – not particularly when the presidential election is 43 days away. A stimulus package can lead the bulls to try to regroup – a failure thereof can result in hurried unwinding of several elevated metrics, some of which are mentioned here.
Thanks for reading!


