
A Final Try At 4310?
Current Position of the Market
SPX Long-term trend: There is some evidence that we are still in the bull market which started in 2009 and which could continue into 2021 before major cycles take over and it ends. A move up to ~4500 is possible before the current bull market makes a final top and SPX corrects into its next major cycle low due in 2023.
SPX Intermediate trend: SPX Fell short of its base projection of 4310 but may be trying to reach it again.
Analysis of the short-term trend is done daily with the help of hourly charts. They are important adjuncts to the analysis of daily and weekly charts which determine longer market trends.

Cycles: Looking ahead!
7-yr cycle – Last lows: 2009-2016. Next low: ~2023
Market Analysis (Charts, courtesy of QCharts)
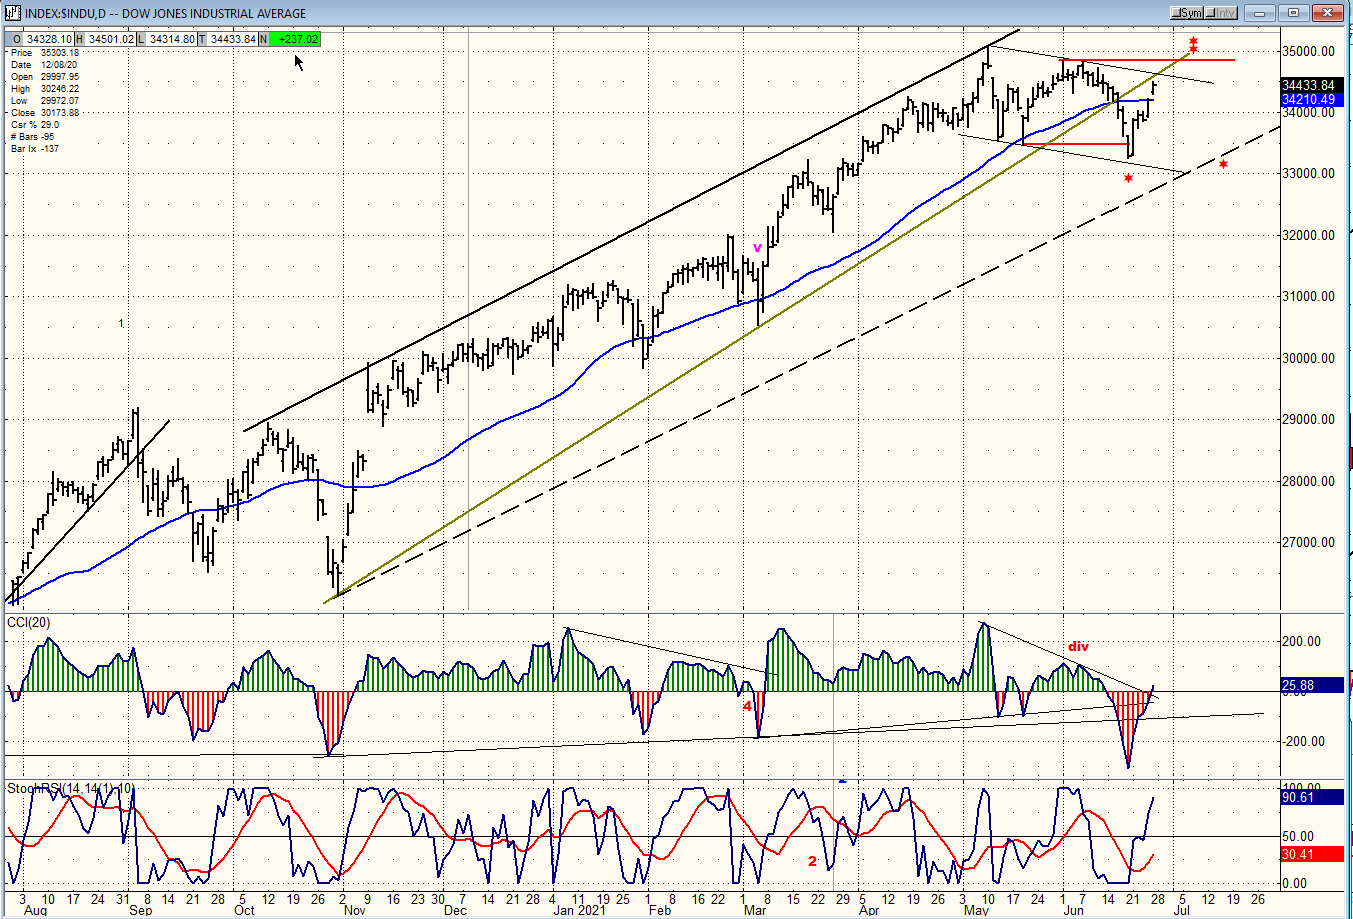
DJIA daily chart
The week before last, a wave of selling placed the DJIA’s intermediate uptrend in jeopardy by breaking its uptrend line and dropping prices below the former short-term low. This is clearly the most weakness experienced by this index since this intermediate uptrend started in late October 2020. The index had a good rebound last week which managed to get it back slightly above its 50-dma, but not above its previous two short-term highs. If it is to nullify what looks like the beginning of a correction, the DOW will have to rise above the top red horizontal line (and keep going), which appears problematic since the strong phase of the short-term cycle is already spent, meaning that, at best, the index will probably only be able to kiss-back the broken trend line before rolling over. Of course, even after breaking its uptrend line, the index remains inside its intermediate channel and no important correction can occur until prices come out of that channel (DIA).
The recent price action makes the DJIA the weakest of the major indices and the bellwether of the coming correction. The NYA is close behind!
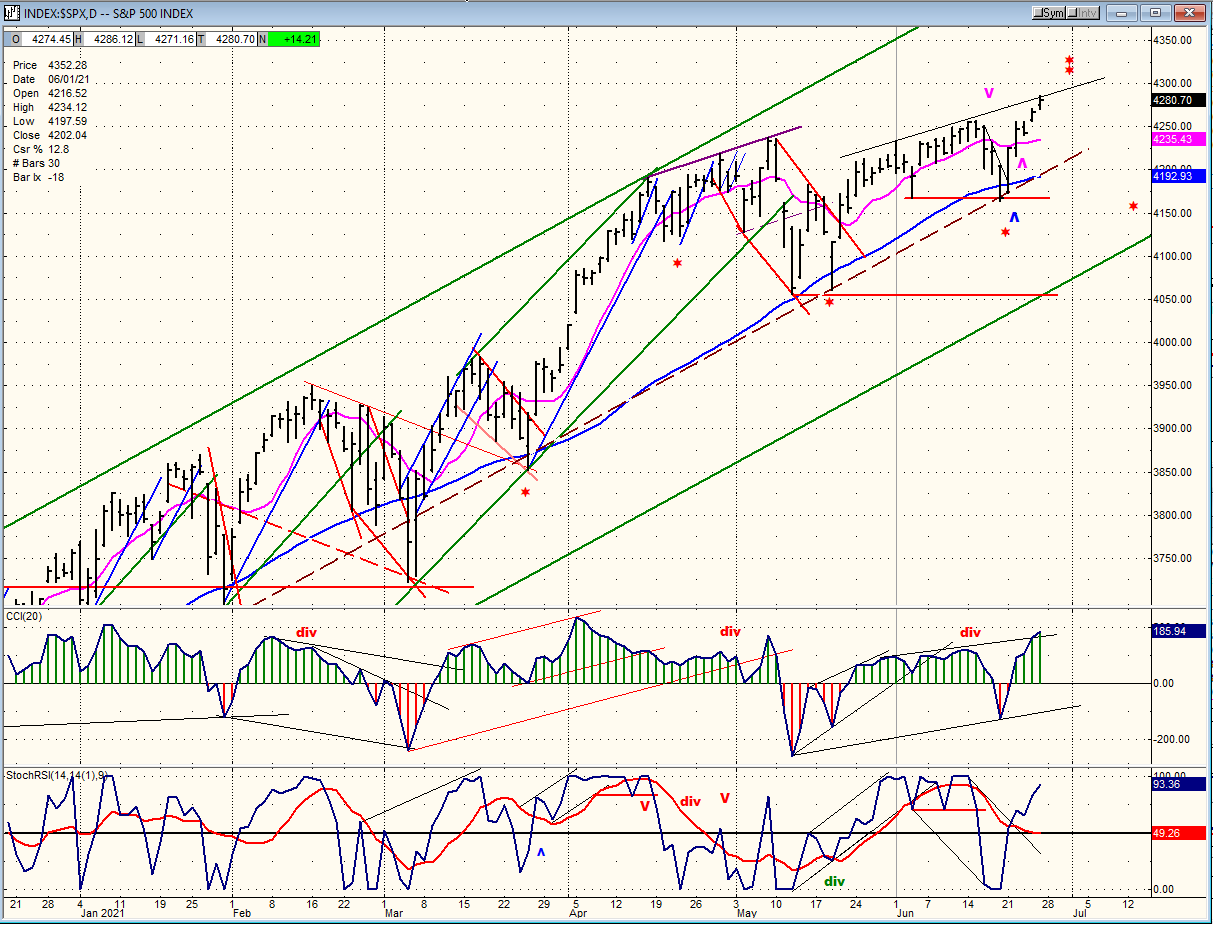
SPX daily chart
Because SPX is a hybrid between DJIA and NDX, strength in the latter kept SPX from severely damaging its uptrend by finding support on the dashed parallel to the intermediate channel line, which means that SPX may still be able to reach its standing P&F projection of 4310 before finding a top. By printing 4286 near the close on Friday, this puts it only 24 points away from its target, and there should be enough oomph left in the short-term cycle to help it reach its goal next week, but perhaps not before a short-term pullback.
From late October and 3234, SPX has been trading in a broad bullish intermediate channel. Since mid-April, it has pulled away from the outside channel line and has been moving across it with an obvious loss of upside momentum. This is a warning that a reversal is near. Breaching the first red horizontal support line should be a sign that an intermediate correction has most likely started, and it should be followed by a break of the inner channel line. Even with the recent short-term rally, it is evident that the index is going to have difficulty continuing to make new highs, even though it did so on Friday.
We should be made aware of the first top of this intermediate wave before the red support line is broken by weakness appearing in the oscillators. After the index fully comes out of its channel and completes its correction, it should go on to make a final (bull market) high from the March 2020 low estimated to be at about 4550 (SPX, NDX).
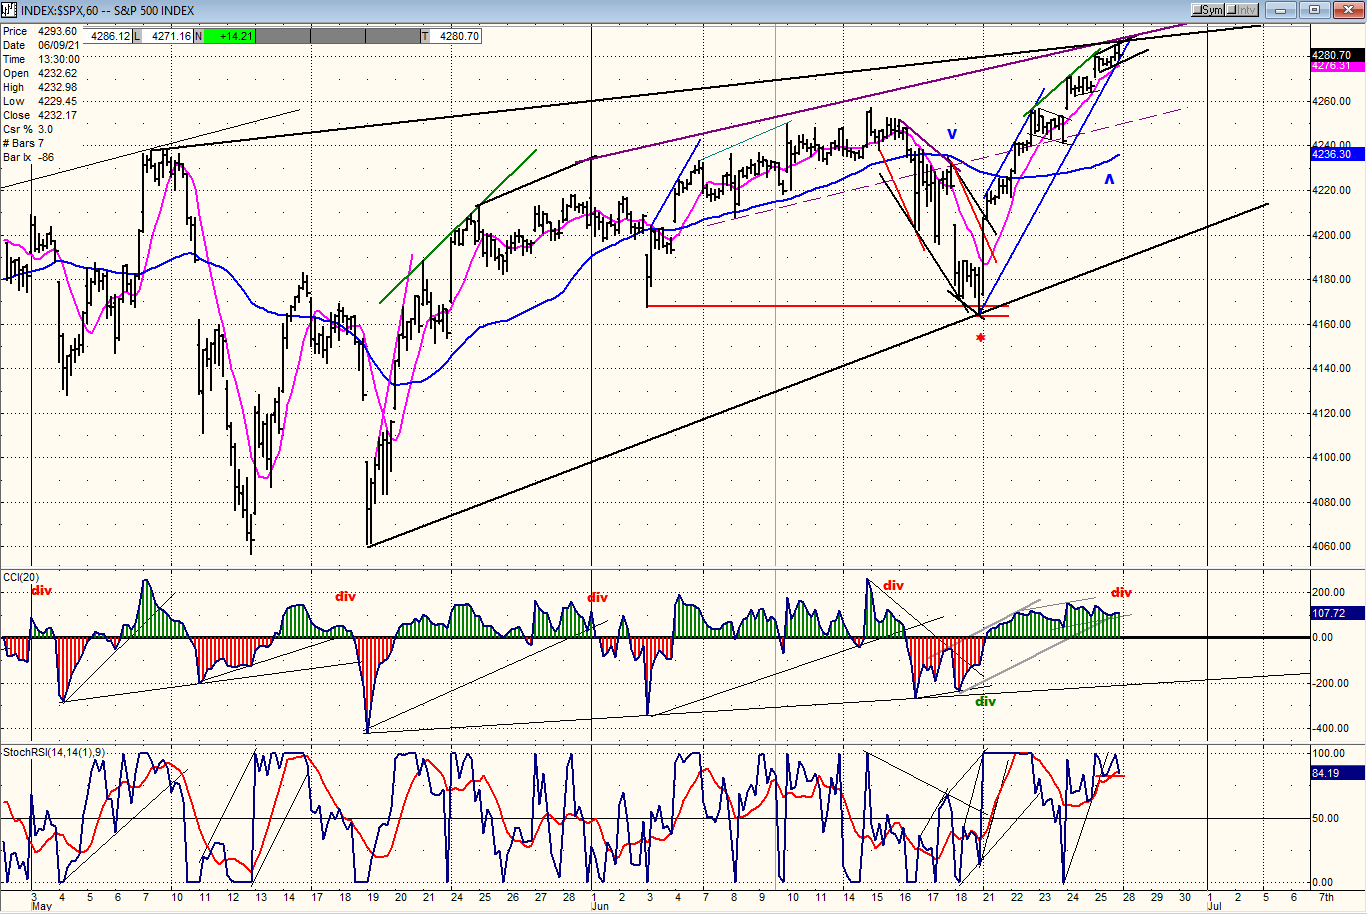
SPX hourly chart
The hourly SPX chart puts the topping phase of the daily chart – the last two months of trading – under the microscope. It reveals a broad deceleration pattern in the form of a wedge which could be coming to an end. Since we do not yet have a short-term reversal of the trend which started five days ago, the top trend lines that define the wedge may require a slight final adjustment, but the negative divergence which has formed in the CCI oscillator is an indication that it could happen at any time. This is also suggested by the deceleration taking place in the short-term trend. Ideally, the cycle powering the trend could have another three or four days to run before it reaches its peak and begins its down phase. That may be just enough strength to get us to the 4310 long standing target.
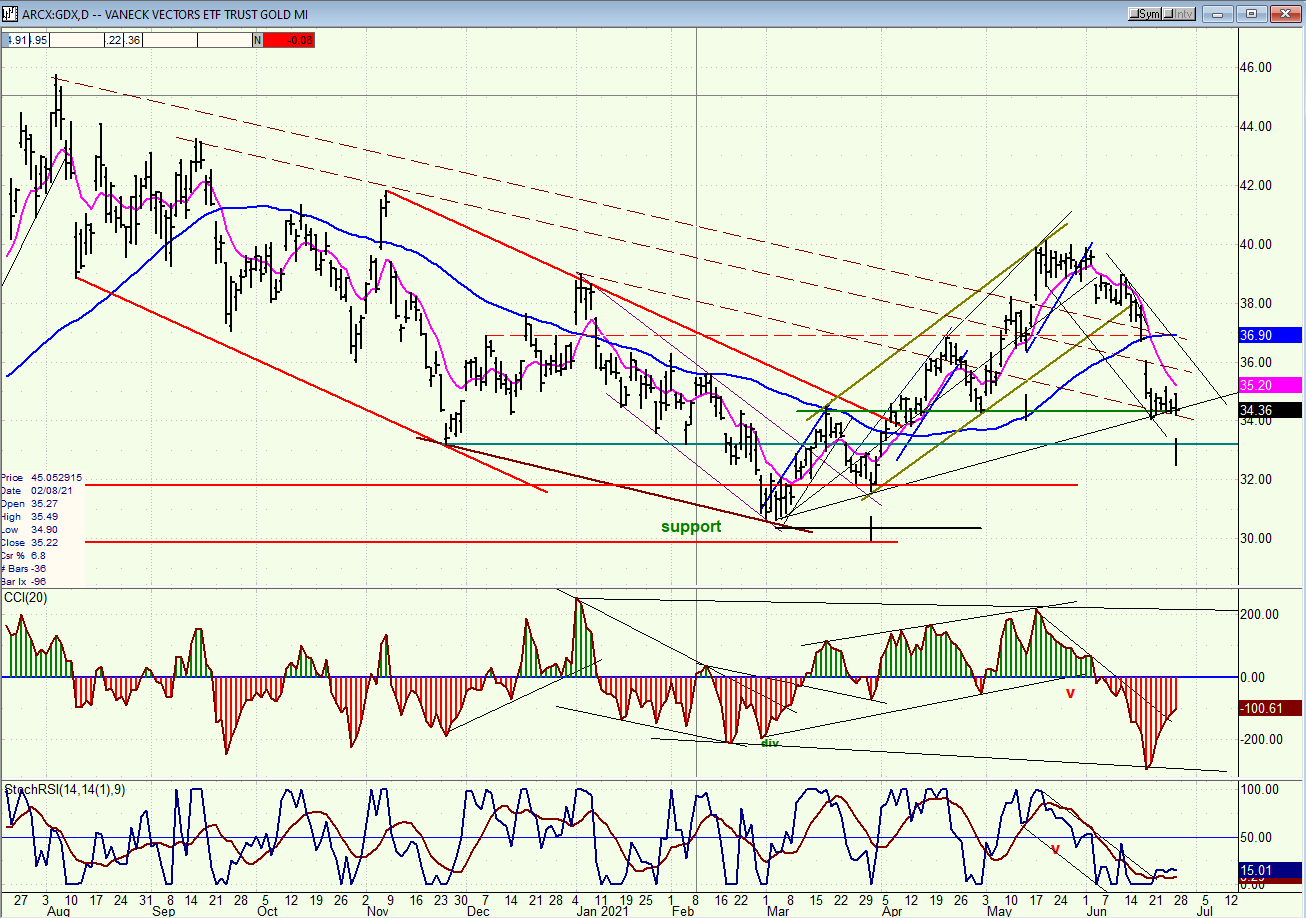
GDX (gold miners) (dly)
For the past week, GDX has tried to hold on to a support level, tied down by one and perhaps two short-term cycles bottoming in the same time frame. If this is correct, a short-term reversal is imminent, but the pullback into that low has affected the P&F pattern, suggesting that some rebuilding of the base may be needed. This could limit the reversal to two or three points (GDX).
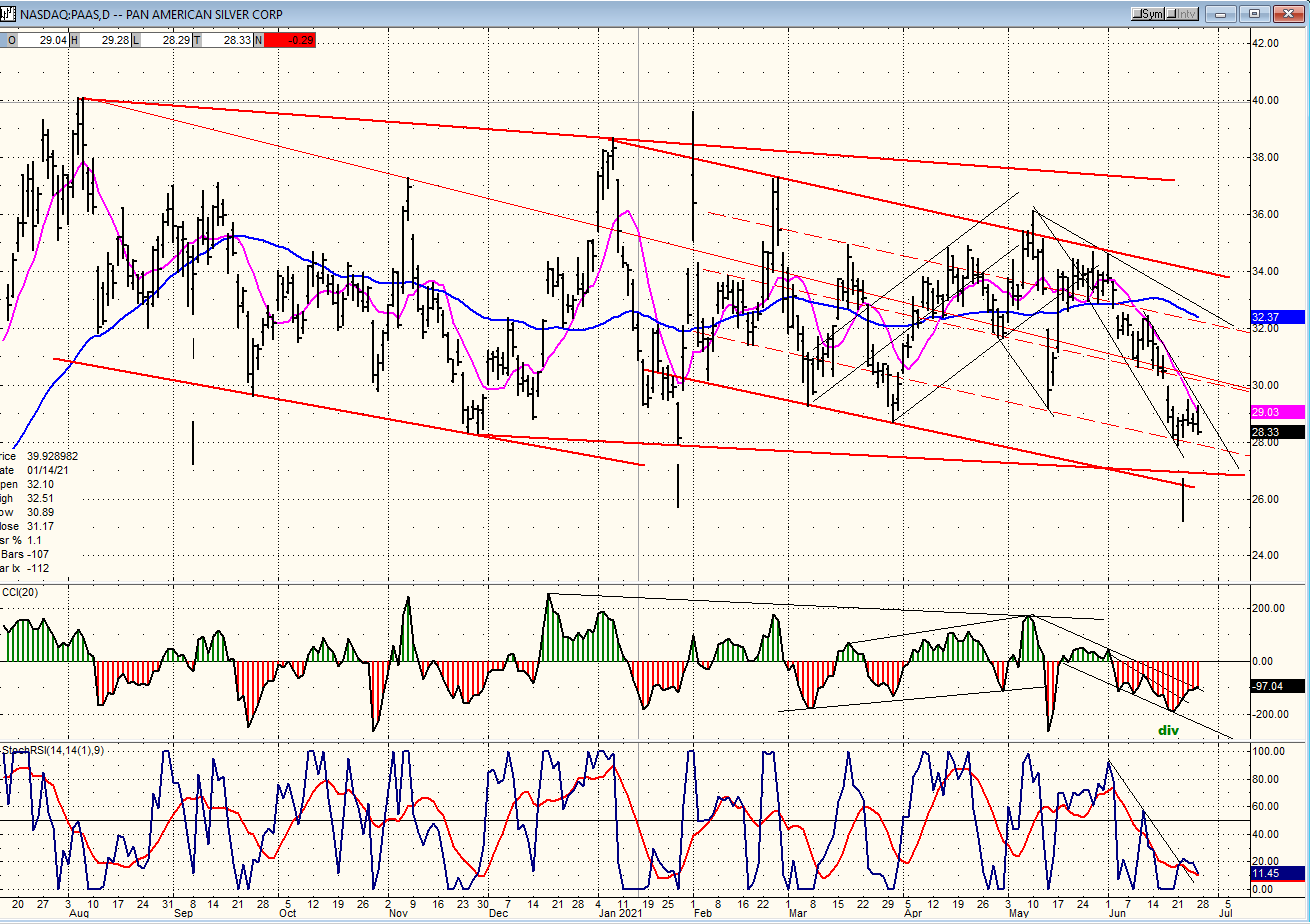
PAAS (dly)
The short-term pattern of PAAS is similar to GDX. It, too has been trading in a tight range for the past few days and it, too, is ostensibly at a cycle low which is about to reverse and create a rebound in the price. Like GDX, limited upside potential should be expected at this time (PAAS).
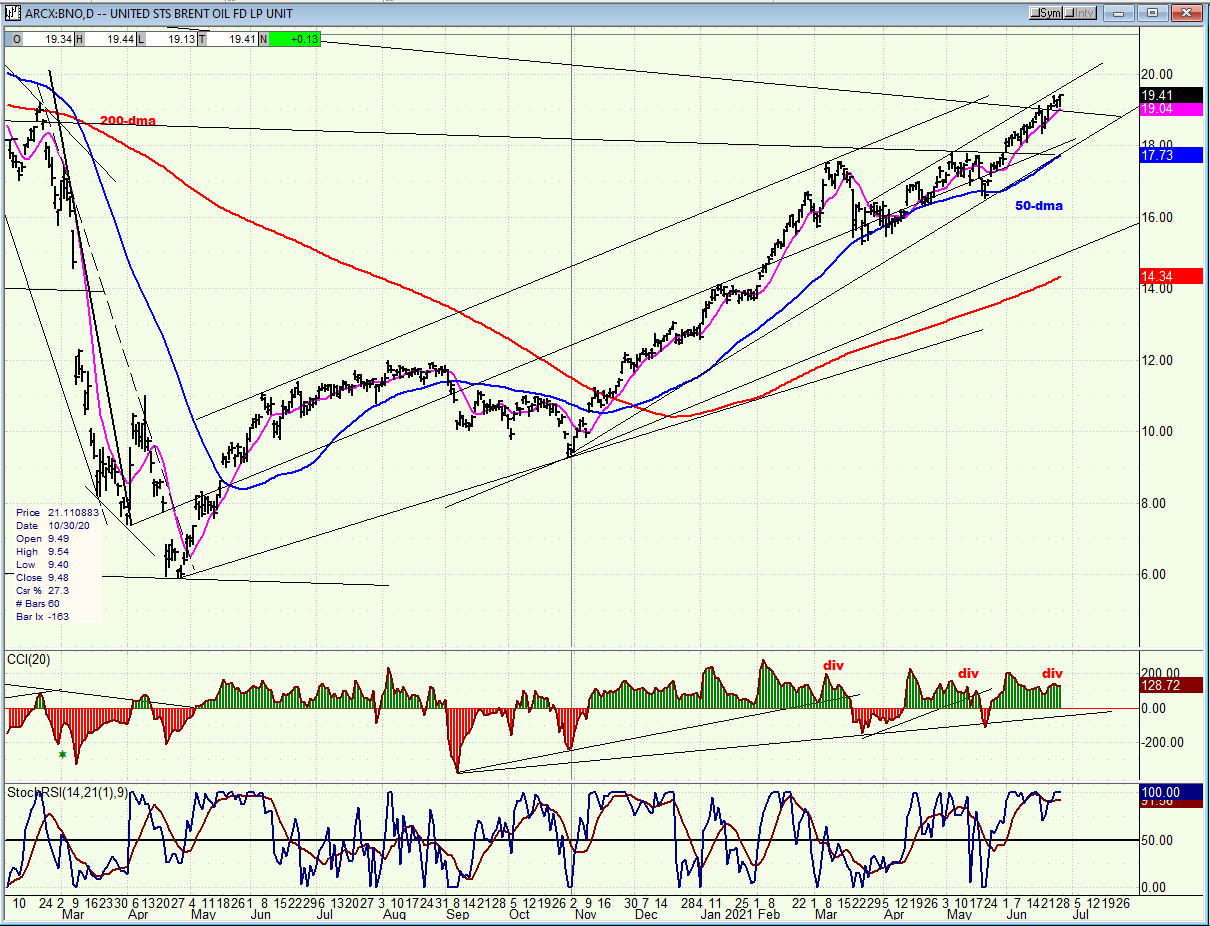
BNO (Brent oil fund) dly
I have mentioned previously that BNO’s trend is a faithful adherent to its 50-dma. Ever since a brief dip below it in August 2020 and a move back above it in September, BNO has trended higher. Recently, a couple of tests of the MA were successful, but the negative divergence showing in the CCI suggests that it may soon be tested again. If it holds, it could bring higher prices. If not, a correction should start (BNO).
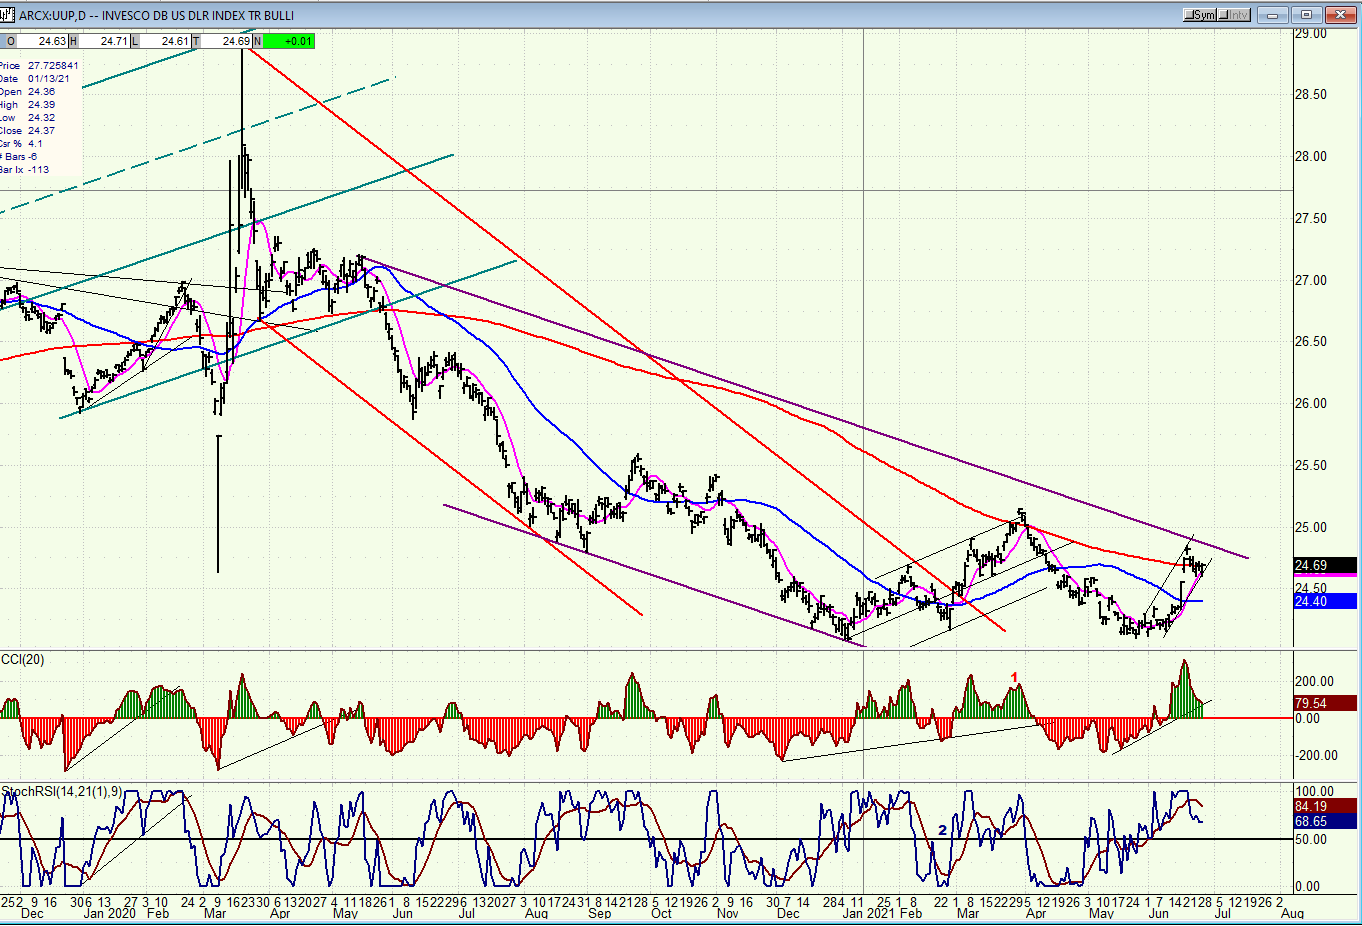
UUP (dollar ETF) (dly) ($USD chart is not available from this data provider)
UUP made a low at the beginning of the year, bounced, retested it, and bounced again. This looks more like a holding pattern than a base formation, but it is too soon to know for certain. Looking at the $USD P&F pattern, it is ambiguous, as well. The index created a top distribution pattern at the 100 level which has been satisfied – for now. The current formation could be only a holding pattern, but the dollar would have to print 88 in order to suggest that it is in a long-term downtrend which could take it lower (UUP).
Summary
While the DOW may already have started an intermediate correction, SPX could not quite do the same on its last dip. It was rescued by a strong NDX which may only just now be reaching an intermediate top. We need to see how much damage is done by the next down-phase of the short-term cycle to determine if all indexes are finally in sync to participate in such a correction.
The above comments, as well as those made in the daily updates and the Market Summary about the financial markets, are based purely on what I consider to be sound technical analysis principles. ...
more

