
A Deep Dive Into The Latest FOMC Day
At its apex yesterday, the Dow (DJI) was up some 350+ points. All major averages were up greater than 1% going into the 2:00 p.m. EST FOMC rate hike announcement. By and large, market participants were expecting/anticipating a dovish Fed rate hike. By and large, that’s what they got. The problem then, as the major averages gave up all their gains and fell nearly 2% after the .25 bps rate hike announcement, was that the Fed wasn’t dovish enough. Market expectations were simply too dovish and set the Fed up for disappointment. But the fault doesn’t lay completely with market participants. We can certainly find fault in the Fed’s messaging and failure to guide market expectations, as former Fed leaders have been able to do. The messaging problem from this FOMC regime, led by Fed Chairman Jerome Powell can be no better identified than in the following chart by Bespoke Investment.
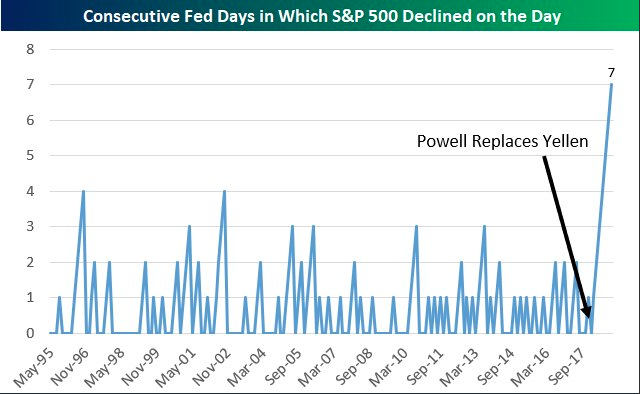
As shown in the chart above, we've now had 7 Fed Days under Chairman Jerome Powell, and the S&P has fallen on all 7 Fed Days. Next longest losing streak was just 4, back in 2002. As stated previously, the Fed’s revised rate hike path tilted more dovish, but not enough and not to the degree the market expected. Messaging fills the gap between market expectations and the Fed’s rate hike/balance sheet forecast. The market has clearly stated the Fed’s messaging by Chairman Powell has been poor.
So what did the Fed deliver to the market by way of its .25 bps rate hike and press conference speech? Firstly, below are the changes offered in the Fed’s statement.
“Consistent with its statutory mandate, the Committee seeks to foster maximum employment and price stability. The Committee expects judges that some further gradual increases in the target range for the federal funds rate will be consistent with sustained expansion of economic activity, strong labor market conditions, and inflation near the Committee's symmetric 2 percent objective over the medium term. Risks The Committee judges that risks to the economic outlook appear are roughly balanced, but will continue to monitor global economic and financial developments and assess their implications for the economic outlook.”
Prior to the most recent FOMC rate hike and press conference, the Fed’s dot plot forecasted 3 rate hikes were probable for 2019. Based on weakening global economic activity, weakening PCE data and declines in interest rate sensitive industries (housing and autos), the Fed acknowledged the variables and reduced their rate hike forecast from 3 hikes in 2019 down to 2 rate hikes. The market was expecting the FOMC to forecast only 1 rate hike, at best, for 2019. The Fed was dovish, but not dovish enough given the market expectations.
Moreover and where the equity market really started to unravel was when Fed Chairman Powell stated the Fed was satisfied with its program to reduce the balance sheet and it has no plan to change it. This statement was akin to Chairman Powell’s perceived autopilot statement surrounding future rate hikes from the September FOMC meeting. So while expressing data dependency for future rate hikes, the lacking of flexibility regarding the balance sheet’s monthly run-off of some $50bn in Treasuries proved the undoing of the market on Fed Day.
“Powell said he sees no problem with balance sheet runoff. That’s the one that hurts,” said James Paulsen, chief market strategist at Leuthold Group. “That’s another potential path of dovishness that he didn’t take.”
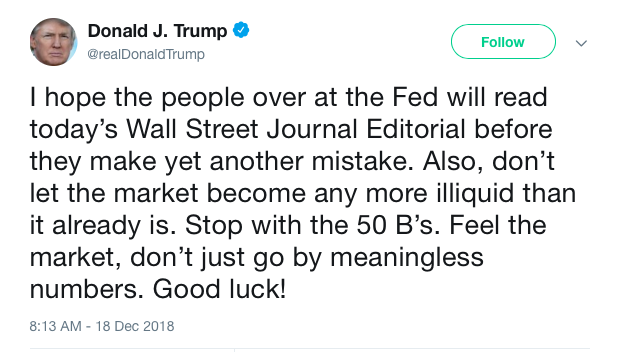
Many view the monthly reduction of the Fed’s balance sheet as just another rate hike as the selling of Treasuries otherwise raises rates. The seemingly autopilot messaging on the balance sheet run-off was obviously disconcerting to the market. This was the 2nd time in as many Fed press conferences that the Fed Chairman has missed an opportunity to become more dovish and/or align messaging with market expectations. To the President’s most recent tweet aimed at the Fed, “Feel the market”, it seems to be more prescient than previously thought to be.
The Fed’s failure to bridge the gap between market expectations and Fed policy is a failure on the part of the Fed Chairman. It’s very clear to the market at this point that while tilting more dovish than in previous meetings, the Fed Chair is not willing to turn completely dovish at this point. The market’s reaction was appropriate as it sends a message to the FOMC and can achieve greater alignment in the future.
The bigger problem for the market is that while the Fed has reverted to its data dependency, the data for which it greatly relies upon, employment and inflation, has not changed to any degree of significance.
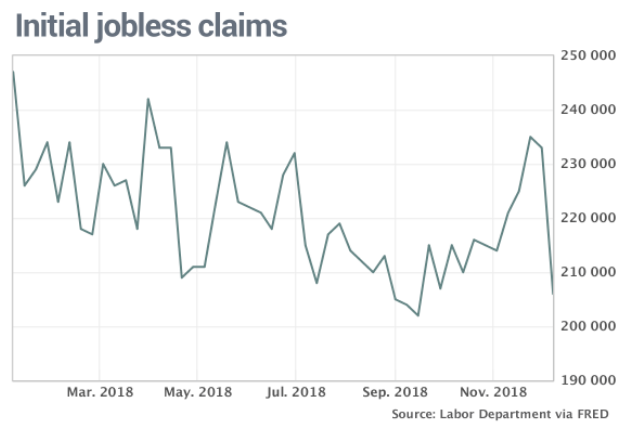
The economy is growing jobs by nearly 200K a month through 2018. The number of Americans applying for unemployment benefits plunged by 27,000 in early December to 206,000, erasing a surge around Thanksgiving that now appears to have been a temporary blip triggered by an earlier-than-usual holiday. The decline in applications for benefits puts claims back near a half-century low. The inflation mandate of the Fed rate hike policy has also cooled since the summer with Personal Income and Expenditures declining in consecutive months.
Here’s the reason I point out the issues of the data out and why it’s an issue for the market and the Fed. The data is clearly favorable for the economy. We have a strong labor market with inflation under control. Heck, even oil prices or prices at the pump are supportive of strong consumer trends. The Fed has recognized these favorable conditions in citing the strength of the economy, but for the sake of housing data. So the market wants less rate hikes because it has proven to curtail activity for interest rate sensitive industries, but the Fed doesn’t want the economy to overheat from easy monetary policies. So the Fed lowered rate hike probabilities, but the market simply wanted too much. In some sense, the Fed was predisposed to failure. But again, the gap between the two desired outcomes is messaging. Despite the market’s expectations and heavy burden placed on the Fed’s shoulders, here’s what Jim Caron, fixed income portfolio manager at Morgan Stanley Investment Management had to say about the recent Fed Day.
“I don’t think they’re seeing the dovish aspect of this. The bond market does,” he said. “The Fed was bound to disappoint. They just couldn’t be dovish enough. That’s just the way it was set up. Do I think this is the correct response? No. I think this is the equity market saying they didn’t cut their interest forecast the way they should have. There’s disappointment…I read what Powell said as very dovish. The bar I think he set to hike was very high.”
For all practical purposes, the Fed’s rate hike path and policies only exist on paper/PDF. The Fed stating that it is data dependent should be enough to rationalize market participant fears as data changes from month-to-month. But again, Fed Chairman Powell hasn’t been able to quell such fears in his messaging, leaving investors to look at the data and rationalize the probability for Fed policy error.
What I think investors should take away from the latest Fed Day and Chairman Powell’s press conference are the following:
- The Fed has reverted to data dependency. “From this point forward we are going to letting the data speak to us and inform us,” said Powell, adding that that would make the path of tightening uncertain. In other words, the forecast is on paper, it is not set in stone and it is not on autopilot.
- Powell also said during the news conference that the Fed was near the low end of the range for neutral. The Fed changed its average long-run rate for fed funds to 2.8% from 3% was very dovish, indicating it sees interest rates near neutral.
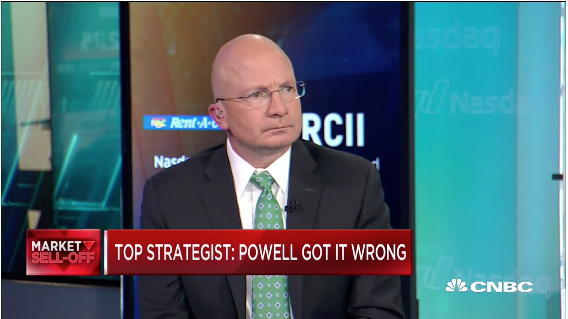
The biggest tell for “how wrong” the Fed “got it” (messaging) can be viewed through the credit market. Bond yields fell mightily as the Fed Chairman’s press conference droned on. The 10-year yield fell almost 7 bps as the yield curve flattened from 16 bps to nearly 10 bps on the day. In a recent CNBC interview post the Fed Day chaos, Tony Dwyer discusses his thoughts and reviews historic statistics regarding the current state of the Fed, as it correlates to the market.
In my most crude considerations for Fed Day and how it relates to the market, I offer the following: The Fed is trying to thread the needle between market expectations and normalizing rates. This is something former Fed governorships have failed to do throughout history. The fact is, which decaying Treasury identifies yields over time, the task is an impossibility. The current FOMC is doing the right thing with monetary policy, but messaging is missing the mark and can ultimately produce a negative feed back loop that is otherwise self-reinforcing. In other words, the economy is on solid footing by most measures of economic data, but the stock market is not on solid footing. Therefore, should the market persistently rationalize the Fed’s forecasts and activities as less dovish than need be, it can create bear market scenarios that bleed into the actual economy. The latest messaging failure surrounding the Fed’s balance sheet run-off activity being on autopilot was another big error by the Fed Chairman, which causes the market to discount future errors, as it did Wednesday.
What’s most apparent is something I’ve discussed in earlier research articles. It centers on the theme that most of the stock market’s issues are very much manmade or driven by policy. The Fed’s messaging failure is just another manmade issue, not unlike trade policy FedEx’s CEO comments on the company’s recent quarterly report mirrors this understanding.
“I’ll just conclude by saying most of the issues that we’re dealing with today are induced by bad political choices,” Smith said. “I mean, making a bad decision about a new tax, creating a tremendously difficult situation with Brexit, the immigration crisis in Germany, the mercantilism and state-owned enterprise initiatives in China, the tariffs that the United States put in unilaterally. So you just go down the list, and they’re all things that have created macroeconomic slowdowns.”
I continue to state the economy itself is on solid footing; even those aspects of the economy that have shown declines like housing are not performing in kind with historic trends. Even certain housing data has shown improvement MoM.
Housing starts ran at a seasonally adjusted annual 1.256 million rate in November, the Commerce Department said Tuesday. That was 3.2% higher than in October. More importantly, the annual decline from the peak in January is nothing more than what we saw from housing starts in 2015.
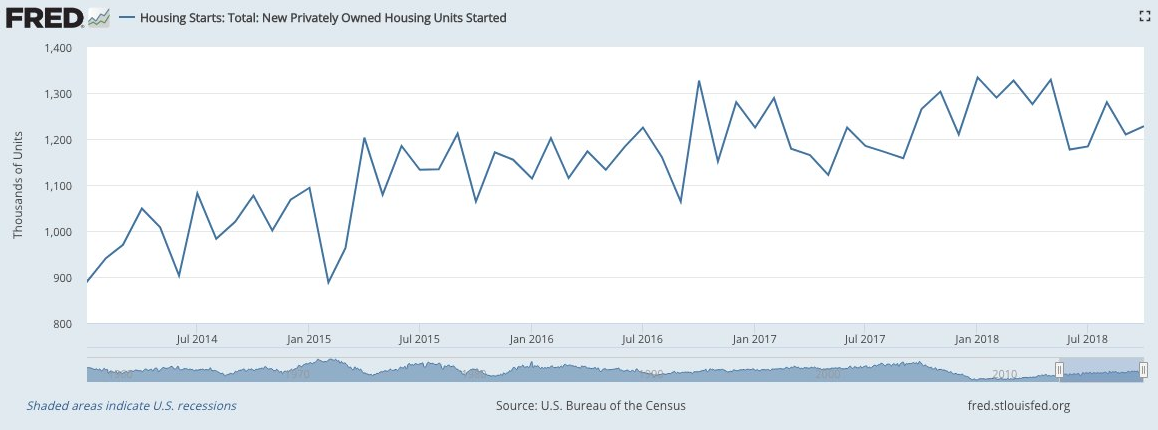
Housing starts are still higher than where they were in 2014. Additionally, the chart shows there has never been any steady uptick in housing starts, it’s a very jagged chart filled with peaks and valleys. To further this point, the latest existing home sales data also showed an uptick on a MoM basis.
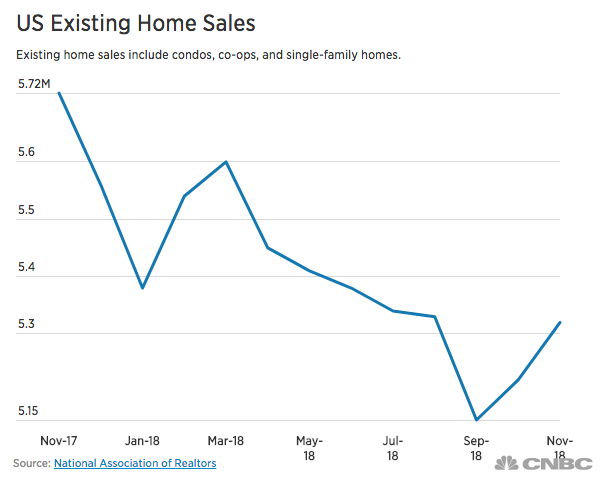
The National Association of Realtors said on Wednesday existing home sales increased 1.9 percent to a seasonally adjusted annual rate of 5.32 million units last month. October’s sales pace was unrevised at 5.22 million units. Sales have now increased for two straight months. But even with improving housing data, the damage to the stock market has already been done.
Most of the S&P 500, 60 percent of members, closed in bear market territory on Wednesday and after the Fed’s press conference. The S&P 500 itself is down roughly 15% from its peak in September. Technically, the S&P 500 remains in correction territory, defined by a decline of 10-19 percent. A bear market is defined by a decline of 20% or more from the peak level. As shown in the chart below, several sectors of the S&P 500 are in bear market territory already.
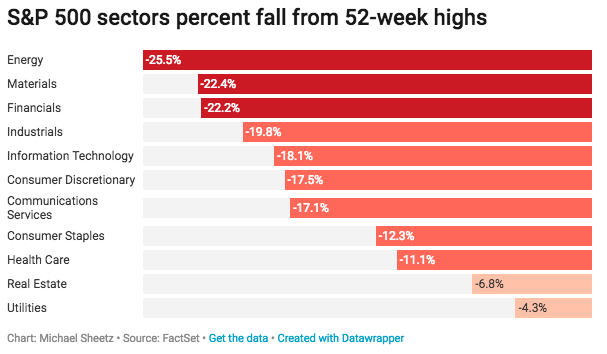
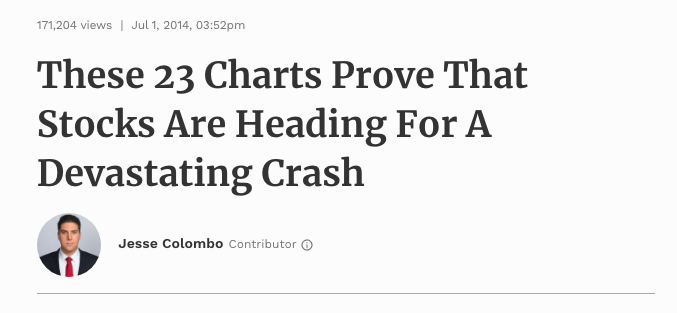
Combined with these sectors that are in a bear market, exactly 300 of the total stocks in the S&P 500 are in a bear market. In short, we would suggest that the market conditions, by and large, describe a bear market, but so did the conditions that were present in late 2015-early 2016. Everything that is being said about the current correction back then is being said about the current correction. Quite literally the same things. “Debt is too high, the Fed is tightening, oil is plunging, credit is tightening, the bubble is coming to an end.” The bubble of everything Forbes columnist and investor at Clarity Financial, Jesse Colombo, is doing his victory lap during the current market correction. But he does this for every market correction. Jesse is a constant promoter of the bubble of everything theory and is always calling for a market crash, always. (article from 2014)
What was oddly unique, depending on your point of view, from yesterday’s precipitous intraday reversal was that the VIX was flat on the day. Keep in mind that it was down over 10% prior to the market collapse, but nonetheless finished exactly flat on the day despite a 1.5% S&P 500 decline. But what this goes to show or prove, is that the VIX is a not just a measure of fear but a measure of uncertainty in the market. Going into the Fed meeting there was uncertainty, investors hedged. Most investors believed they knew what was to be offered from the Fed on Fed Day and thus removed their hedges in favor of greater market exposure, thus reducing fear and proving to lower the VIX spot price.
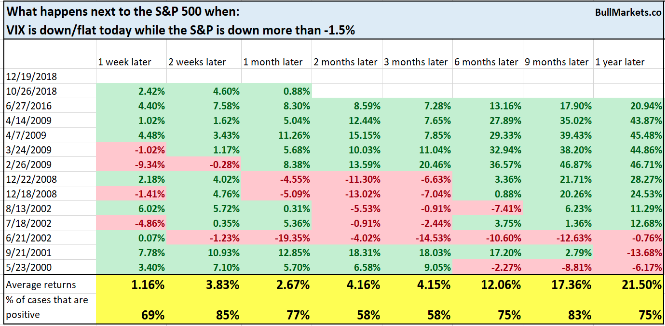
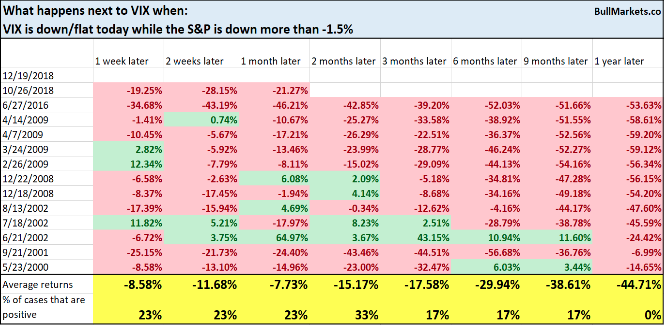
Do I see a market bottom now that S&P 500 has breached 2,500 and may have priced in the worst for 2019, no EPS growth? That’s something we’ll share with subscribers, but in terms of the VIX, here’s an interesting study/table from Troy Bombardia on what may come from the VIX after Wednesday’s performances. Here’s what happened next to the S&P & VIX when the S&P fell more than -1.5%, while VIX was flat/down.


Fascinating article. We know the Fed was too tight leading up to the Great Recession, a decade ago. It clearly is trying for a softer landing this time. Pushing the stock market down a little is likely preferable to what happened in the Great Recession. We are back to the exact same things to look for as back then, possible credit unavailability due to speculation failures and NGDP measurements. Inflation is not as important as those two. In the Great Depression, inflation rolled on for months while NGDP was cratering.