
4Q2018 Final: Headline Productivity Improved But Roughly The Same As Unit Labor Cost Growth
A simple summary of the headlines for this release is that costs and productivity rose around the same amount in 4Q2018.

Analyst Opinion of Productivity and Costs
The preliminary release was affected by the government shutdown so the final release now provides the first glimpse of productivity in 4Q2018. Note from BLS:
This is the first publication of fourth quarter and annual average 2018 measures of labor productivity and costs for the business and nonfarm business sectors, reflecting the Feb. 28, 2019 release of source data on output and compensation by the U.S. Department of Commerce. Also, data in this release reflect the annual benchmark revision of BLS Current Employment Statistics program data on private nonfarm employment and hours, and historical revision of those data
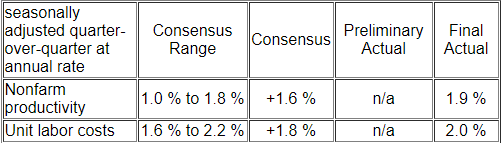
The overall view this quarter is that productivity is up 1.9% from the same quarter one year ago, while unit costs are up 1.0%.
The market was expecting from Econoday:
(Click on image to enlarge)
Please note that the following graphs are for a sub-group of the report nonfarm > business.
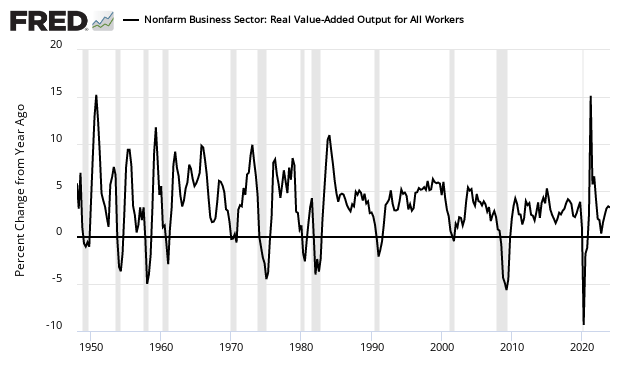
Seasonally Adjusted Year-over-Year Change in Output of Business Sector
(Click on image to enlarge)

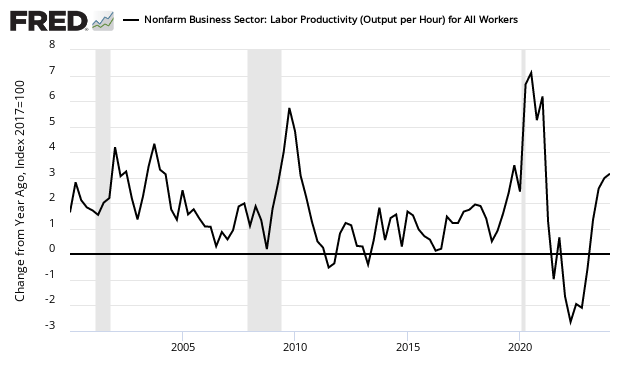
Seasonally Adjusted Year-over-Year Change of Output per Hour for the Business Sector
(Click on image to enlarge)
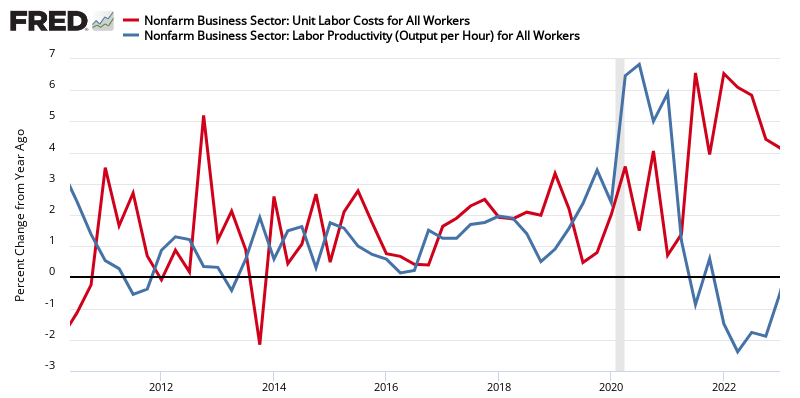
All this is happening while business sector unit labor costs increased.
Seasonally Adjusted Year-over-Year Rate of Change of Unit Labor Costs
(Click on image to enlarge)
The headlines from the press release:
Nonfarm business sector labor productivity increased 1.9 percent in the fourth quarter of 2018, the U.S. Bureau of Labor Statistics reported today, as output increased 3.1 percent and hours worked increased 1.2 percent. (All quarterly percent changes in this release are seasonally adjusted annual rates.) From the fourth quarter of 2017 to the fourth quarter of 2018, productivity increased 1.8 percent, reflecting a 3.7-percent increase in output and a 1.9-percent increase in hours worked. Annual average productivity increased 1.3 percent from 2017 to 2018.
Preliminary Chart for 4Q2018
(Click on image to enlarge)

Final Chart for 4Q2018
(Click on image to enlarge)

My view of Productivity
My view of productivity is very different from the headline view. Productivity is complicated - far too complicated for economists to come to a conclusion satisfactory to this simple Industrial Engineer:
Generally speaking, productivity is, in industrial engineering, defined as the relation of output (i.e. produced goods) to input (i.e. consumed resources) in the manufacturing transformation process.
Productivity assessments even within a single company are very complicated, and are impossible to accurately forecast when one wants to discuss an entire sector or economy. There are some rough tools which will get one into the ballpark of productivity improvement. The following graphs on manufacturing, investment, retail trade and health care are comparing inflation adjusted growth of that sector to employment growth in that sector - as well as for the economy overall.
In the case of the economy overall, output (blue line) and employment are now growing at the same rate.
(Click on image to enlarge)

In the case of manufacturing, output (blue line) and employment are now growing at the same rate. Prior to the Great Recession, output grew whilst employment fell.
(Click on image to enlarge)
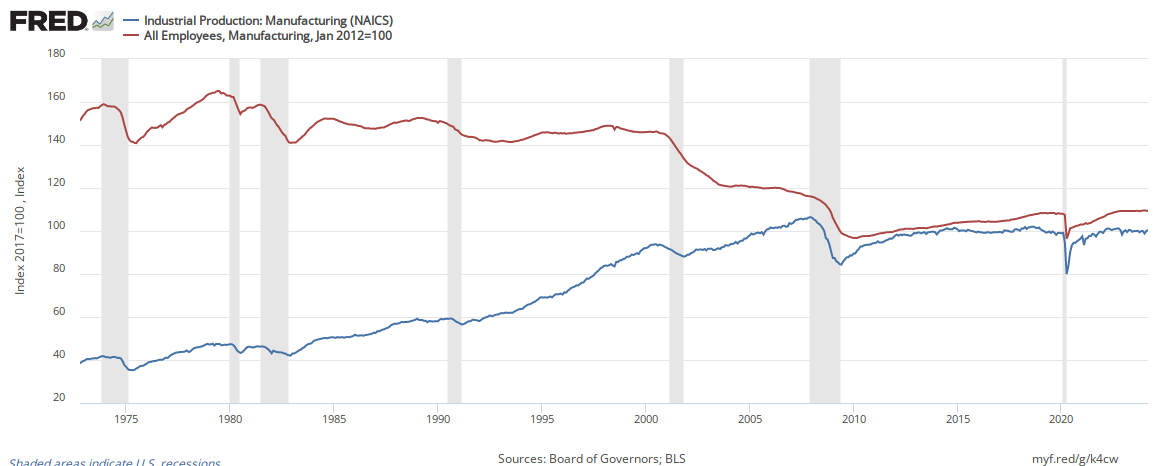
The above chart is saying there is no productivity growth in manufacturing - even with our belief that robotics are doing away with jobs.
A slightly different situation is true with construction. Since 2012, construction output and employment are growing at the same rate implying there is no productivity growth. But during the Great Recession and its immediate aftermath, productivity appears to have declined.
(Click on image to enlarge)

The only real productivity growth I can find is in the services sector. Beginning with the retail sector, the obvious gain in productivity is seen thoughout the graph below and continues today.
(Click on image to enlarge)

There also is improvement in the health care sector.
(Click on image to enlarge)

The above look at productivity is down and dirty - but it should provide a realistic ballpark productivity assessment. Real productivity should not have significant fluctuations except during recessions which makes one skeptical of the headline view.
Another way of looking at productivity is the year-over-year rate of growth of GDP per employed population - red line) vs. GDP per capita (blue line). This metric is partially showing how well business is utilizing the labor force - and in a rough way looks at productivity growth if one eliminated government transfer payments from GDP. (see red line in graph below):
(Click on image to enlarge)

The above graph suggests productivity growth is roughly 1.1 % per year. This analysis also suggests for the last two years, the health of the economy has been improving.
The problem really is that economists only understand money flows - and how they got into measuring productivity is beyond my comprehension. This is an extremely nuanced calculation which is never totally accurate as you are shifting technology or methods. but the core of industrial engineering is a measure of labor hours - and that is foreign to they way the BLS measures productivity..
As one outsources, one would expect labor hours to drop - and that should be relatively accurate.
But the prime reason one is driven to optimize productivity is profits. when a methodology to improve productivity is considered, this calculation is about costs - how much does it cost to get the productivity gain.
Now the spoiler today is likely logistics - as robotics mean that one can produce a product literally anywhere in the world (so labor cost is no longer the prime factor - although pollution is and many processes are inherently dirty). Logistics becomes the primary element which means manufacturing is coming back to the USA.
But as new manufacturing re-appears, the labor growth is likely equal to product output (as the old labor intensive technologies were exported and what was left was productivity efficient).
Caveats Relating to Productivity
Productivity is determined using monetary criteria, and does not recognize outsourced man hours - in other words, if a business cuts half of its workforce by outsourcing a sub-component or sub-service, this would be a 50% productivity improvement.
These productivity measures describe the relationship between real output and the labor time involved in its production. They show the changes from period to period in the amount of goods and services produced per hour. Although these measures relate output to hours at work of all persons engaged in a sector, they do not measure the specific contribution of labor, capital, or any other factor of production. Rather, they reflect the joint effects of many influences, including changes in technology; capital investment; level of output; utilization of capacity, energy, and materials; the organization of production; managerial skill; and the characteristics and effort of the work force.
Econintersect believes a better measure (if you must use monetary tools to tract productivity) would be competitiveness.
Looking at productivity / output long term - output fall below 0% year-over-year change is a good sign that a recession is underway. Another way to look at it - if productivity rate of gain is falling, this could be an indicator a recession is coming.
(Click on image to enlarge)
Disclaimer: No content is to be construed as investment advise and all content is provided for informational purposes only.The reader is solely responsible for determining whether any investment, ...
more

