
4 Of Top 5 US Stocks Set To Report This Week, July Is Shaping Up As Potentially Bearish Shooting Star On Nasdaq 100
Tech stocks rallied massively in the past four months, with the leaders outpacing the soldiers by a wide margin. Last week, post-earnings reaction to several tech stocks including MIcrosoft (MSFT) indicated a ‘sell the news’ phenomenon. This week, four of the top five US stocks report. How they behave will decide how July shapes up, which thus far is on course for a potentially bearish shooting star.
Last week, tech bulls used June-quarter earnings as an excuse to lock in gains. Post-earnings, International Business Machines (IBM), Tesla (TSLA), Microsoft (MSFT) and Intel (INTC) all sold off. Before this, they all rallied massively from their March lows. MSFT is the one of the five largest US companies.
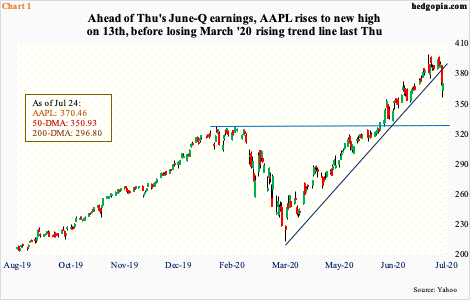
This week, the other four – Facebook (FB), Apple (AAPL), Amazon (AMZN) and Alphabet (GOOG) – report. FB reports on Wednesday and the other three on Thursday. Ahead of this, as the most valuable company with a market cap of $1.6 trillion, AAPL does not act well.
Two Mondays ago – on the 13th – the stock (370.46) rose to a new all-time high of 399.82 before reversing hard. Last Thursday, it breached a rising trend line from March (Chart 1). Both the 10- and 20-day moving averages have been lost. Friday was a down session, although buyers showed up just above the daily lower Bollinger band; the session low of 356.58 was not that far away from the 50-day at 350.93. A breach of the average opens the door to a test of the January-February highs in the 320s.
How AAPL, and the others, behave post earnings will have huge consequences for markets in general and cap-weighted indices such as the S&P 500 large cap index and the Nasdaq composite in particular.
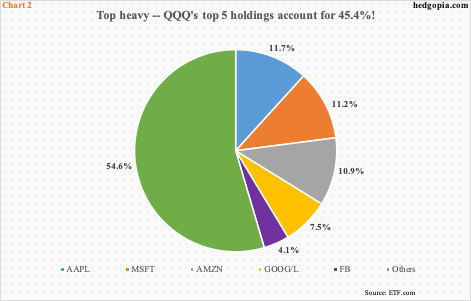
Investor love for these leading names has gotten to a level where they are beginning to control too big a slice of the overall market. In the Nasdaq 100/QQQ (Invesco QQQ Trust), the big five command a 45.4 percent weight (Chart 2), which is just a mind-boggling number, come to think of it.
The four reporting this week have a combined share of 34.2 percent, the three reporting Thursday alone account for 30.1 percent. For now, as they go, so go the markets. The risk facing bulls is that at some point gravity begins to exert pressure, which is what we witnessed in last week’s post-earnings reaction in the aforementioned four names.
Leading up to this, the Nasdaq 100 index looks wobbly.
First of all, from its intraday low on March 23 through July 13, the index shot up 63.5 percent in less than four months! In just 10 sessions through that high, it jumped 13.6 percent. Talk about going parabolic. Such moves feel nice when they are on the way up and can be equally painful when the opposite happens.
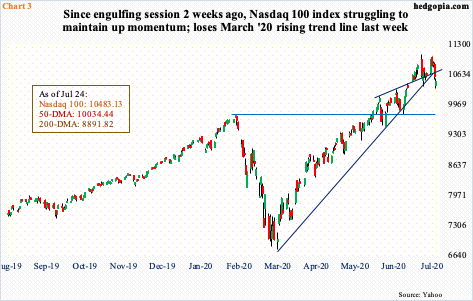
The last two weekly candles indicate distribution in progress. On the daily, the July 13th record high of 11069.26 came in a bearish engulfing session.Last week, Monday started strong, but the next four were anything but. By Thursday, the March trend line was breached (Chart 3). By Friday, both the 10- and 20-day were gone.
The 50-day lies at 10034.44, which has not been tested the past couple of months. A breach will have bears eyeing 9800, which approximates the February high.On June 29, bulls successfully defended this level.
A loss of the February high on the Nasdaq 100 – and by default the 50-day – will decidedly turn odds in bears’ favor.In many ways, they will be vindicated in that they have been adamant in their bearish stance – wrongly, of course, as tech stocks went ballistic.
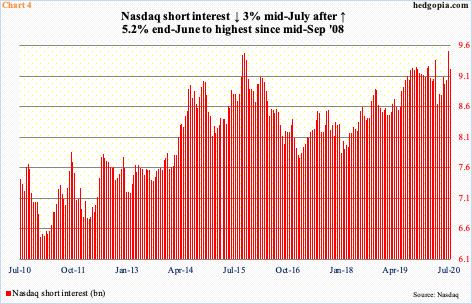
In fact, by the end of June, at 9.51 billion shares, Nasdaq short interest was the highest since mid-September 2008. Mid-July, it fell three percent but remain elevated (Chart 4).
Tech bulls, in fact, were using the high level of short interest as one reason to stay bullish hoping for short squeeze. Many a times in the past, zealous shorts, by covering, have provided a helping hand to the longs. But things do not always turn out this way.
Speaking of September 2008, bears had a field day in that month as well as October and November, as the Nasdaq 100 went from a high of 1973.56 in August to November’s 1018.86. The index, of course, peaked in October 2007 at 2239.23.
Shorts are hoping for a repeat of how things evolved in the latter months of 2008.
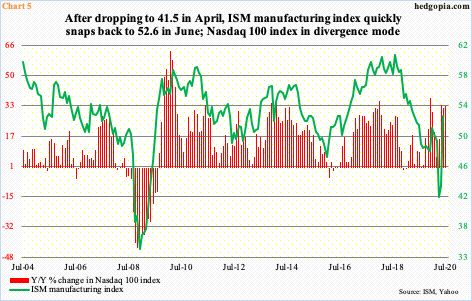
Back then, the ISM manufacturing index dropped all the way to 34.5 in December 2008 and the Nasdaq 100 was down as much as 43.2 percent year-over-year in November that year.By that time, the recession, which lasted from December 2007 to June 2009, was well entrenched. (ISM)
This time around, the manufacturing index dropped to 41.5 in April, before rising in both May and June to 52.6; the last time the Nasdaq 100 had a y/y negative month was in January 2019. The closest it came was a 5.9 percent rise in March (Chart 5).
In other words, tech stocks never quite caught up to the swift decline in manufacturing activity early this year. Of course, the COVID-19 recession only began in February this year and may have a ways to go.
Optimists are hoping for a V-shaped recovery. Indeed, after a rapid decline in economic activity, several metrics have snapped back vigorously.
For instance, from the all-time high of $529.6 billion (seasonally adjusted annual rate) in January, retail sales fell 22.1 percent to $412.8 billion through April, and then increased 27 percent to $524.3 billion by June. Similarly, non-farm jobs went from 152.5 million in February to 130.3 million in April to 137.8 million in June. The ISM manufacturing index itself rose 11.1 points between April and June.
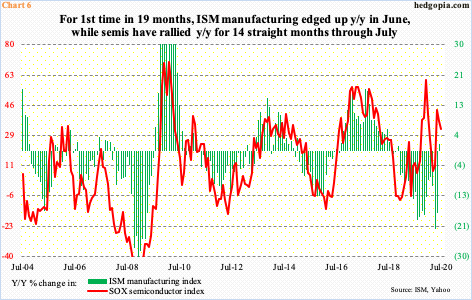
The hope is that semiconductors, which are increasingly considered a modern version of Dr. Copper, will lead manufacturing activity higher. Chart 6 plots the SOX semiconductor index with the ISM manufacturing index using y/y change.
In June, after remaining suppressed in negative territory for 18 straight months, the ISM index edged up 1.9 percent y/y. The SOX, on the other hand, has rallied for 14 months in a row, including this month. Semi stocks were going gangbusters late last year; the pace of y/y rally slowed down to 8.3 percent in March and has regained momentum. Manufacturing activity is yet to catch up to this in earnest.
Of late, the enthusiasm for a V has softened. Amid COVID-19 resurgence, uncertainty has creeped in as to the shape of the recovery. Arguably, semi stocks are pricing in hockey-stick growth, which, more often than not, tends to be elusive.
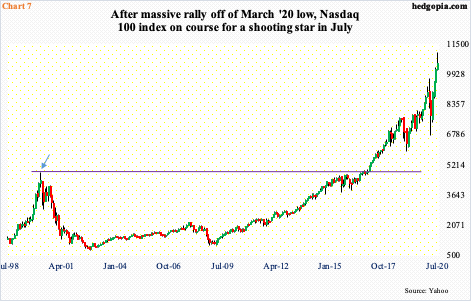
The way the Nasdaq 100 is faring, tech bulls may be beginning to entertain this as a possibility. With five sessions to go this month, the index is on course for a monthly shooting star. This will have come after a hammer reversal in March followed by three marubozus in April, May and June each.
Shooting stars show up after an uptrend and can signal a potential peak. If July indeed ends up forming a shooting star, how August shapes up will decide if an important top has taken place. In March 2000, there was a similar candle with a long upper shadow (arrow in Chart 7). We know what happened in the subsequent months. The attempt here is not to suggest a similar fate awaits the Nasdaq 100, but merely to point out that risks are rising, if nothing else just to unwind the prevailing overbought conditions.
Thanks for reading!


