
Mish’s Economic Modern Family looks to have found temporary support as each of the members has closed over the prior day's high providing relief from the downward trend.
However, will this last, or is the rally a potential trap before the market breaks lower?
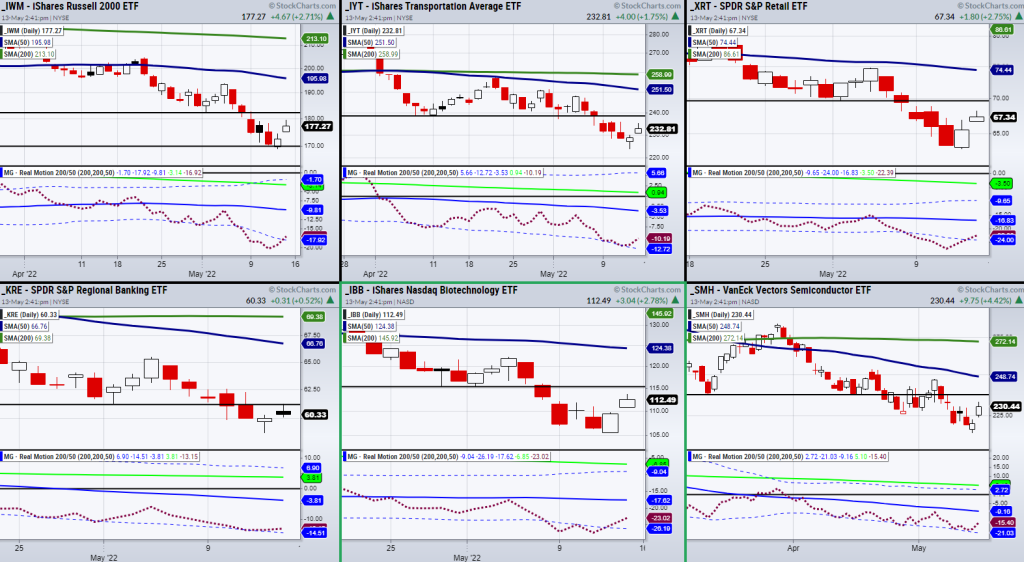
If we look at the above chart, we can see 6 ETFs making up a majority of Mish Economic Modern Family.
The Family is useful for grasping a quick view of where the stock market is heading, and which sectors should be focused on.
Additionally, each chart is paired with our Real Motion momentum indicator which helps us further identify the strongest sectors to watch for Monday.
Across the board, in the Family, and the major indices, we have seen downward pressure stall.
However, when looking at the Real Motion indicator (RM) we can see that certain charts stand out more.
With that said, let’s start with the small-cap index Russell 2000 (IWM).
In the case of IWM, Real Motion (RM) has pulled up from oversold territory as the red dotted line is now clearing the lower band (blue dotted line).
If RM continues to hold over the lower band this will show that momentum is improving thus decreasing the chance IWM will break lower in price.
The same can be said for the Biotech (IBB), and Retail (XRT) sectors with IBB making the strongest comeback from oversold levels in RM.
On the other hand, ETFs like the Transportation (IYT), Semiconductors (SMH), and Regional Banking (KRE) never broke their lower band and are looking to push towards the 50-DMA (blue line) in RM.
While KRE is the weakest of the bunch, IYT and SMH have created a decent amount of space from the bottom of their band and are now looking to push towards the 50-DMA (blue line).
Having said that, the takeaway is that IYT, SMH, and IBB have the most strength from a momentum standpoint.
However, the catch is that the overall market trend is still down meaning any rally can easily be met with resistance.
In the above chart, you will find lines drawn for the most recent resistance levels.
If these price levels are cleared, watch for the 50-DMA as the next key resistance level to clear.


Comments
Log in or sign up to join the conversation.