
1H20 Corporate Profits Collapse, Earnings Revision Trend Improves For S&P 500 Companies Meanwhile
US corporate profits collapsed 21 percent in the first half this year. Directionally, this is in line with operating earnings estimates for S&P 500 companies. In the latter’s case, the revision trend has improved the past two and a half to three months. That said, the sell-side is notorious for optimism early on.
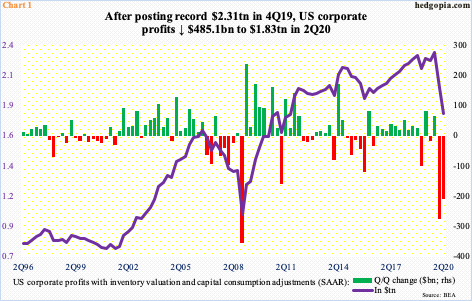
US corporate profits have suffered back-to-back double-digit declines. Profits with inventory valuation and capital consumption adjustments tumbled 10.3 percent sequentially in 2Q to a seasonally adjusted annual rate of $1.83 trillion. This came on the heels of a 12-percent decline in 1Q (Chart 1). Profits reached a record $2.31 trillion in 4Q19. From that high, profits are down $485.1 billion, to a 35-quarter low.
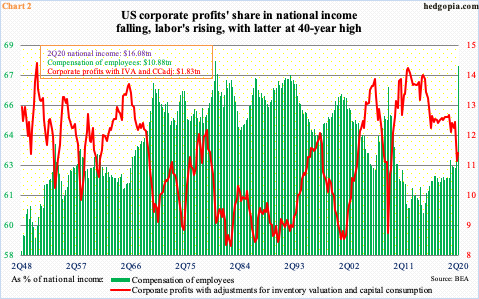
This has helped change the national-income-pie dynamics between corporates and labor. In 2Q, the share of corporate profits with inventory valuation and capital consumption adjustments in national income stood at 11.4 percent, up slightly from 11.1 percent in 1Q, which was the lowest since 2Q09; in contrast, compensation of employees accounted for 67.7 percent – a 40-year high.
As mentioned previously, corporate profits have taken a big hit since 4Q19. Employee compensation, on the other hand, has steadily grown. The 6.8-percent sequential decline in compensation in 2Q was the first quarter-over-quarter drop since 1Q13; $11.67 trillion in 1Q20 set a new record.
Thus, the spike in the green bar in Chart 2 has more to do with a collapse in corporate profits in the first half this year than improvement in employee compensation. In other words, the spike was not a result of generous company boards willing to share a larger portion of the bottom line with their labor force.
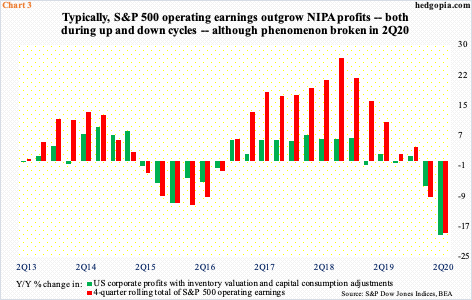
Rather interestingly, the year-over-year decline in NIPA corporate profits and operating earnings of S&P 500 companies was similar in 2Q – down 19.3 percent and down 18.9 percent, in that order. In the past, growth in non-GAAP earnings of S&P 500 companies routinely came in ahead of NIPA profits – both during up and down cycles (Chart 3), leading to questions about the quality of non-GAAP earnings.
It is too soon to say if the 2Q change represents a trend change or a one-quarter phenomenon. In all probability, non-GAAP earnings should continue to look better than NIPA profits. That is the whole idea behind non-GAAP anyway – to make it look better than it really is. Otherwise, GAAP earnings would be the go-to metric.
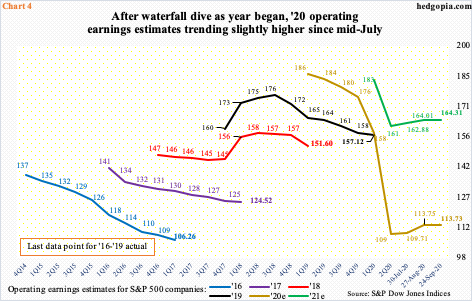
Speaking of which, the earnings revision trend has improved for S&P 500 companies – both for this year and next. With 2020 halfway gone, pretty soon all eyes will be focused on 2021. As of last Thursday, these companies were expected to earn $164.31 next year. This is substantially lower than the $194.23 penciled in by the sell-side in January this year but is higher than $160.89 which was hit in the week to July 16.
The only problem is, as things stand, earnings are expected to grow 44.5 percent next year! The sell-side is notorious for starting out optimistic and then gradually revise lower as the year progresses. For 2020, estimates were $186.36 in March last year and $175.52 at the end of last year. Then, the Covid-19 hit and the bottom fell out. From optimists’ perspective, the good thing is that 2020 estimates have trended higher since dropping to $108.86 in the week to July 8, to $113.73 (Chart 4). If 2021 optimism pans out, the bigger question is if the gap with NIPA profits begins to narrow at all.
Disclaimer: This article is not intended to be, nor shall it be construed as, investment advice. Neither the information nor any opinion expressed here constitutes an offer to buy or sell any ...
more

