

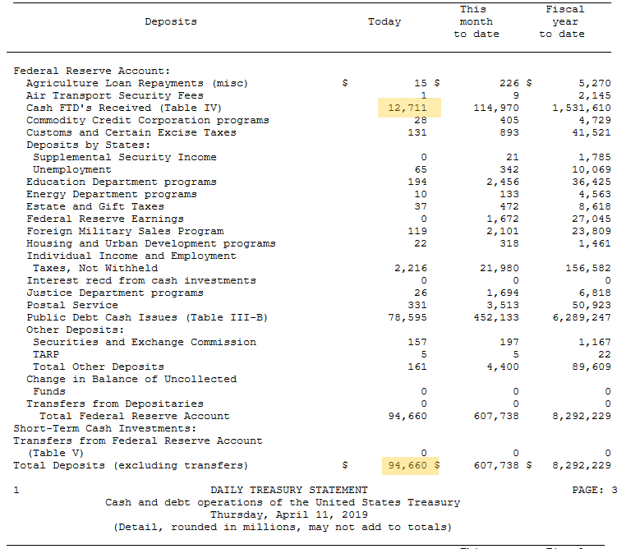
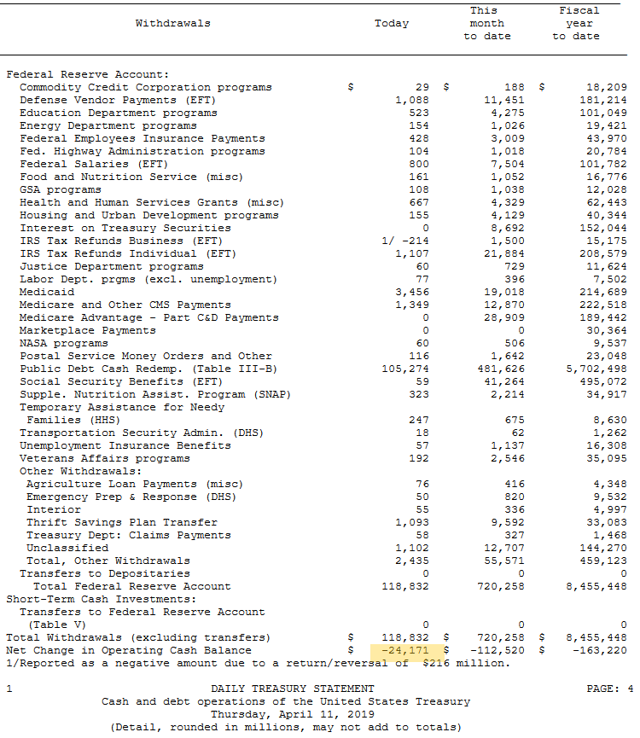
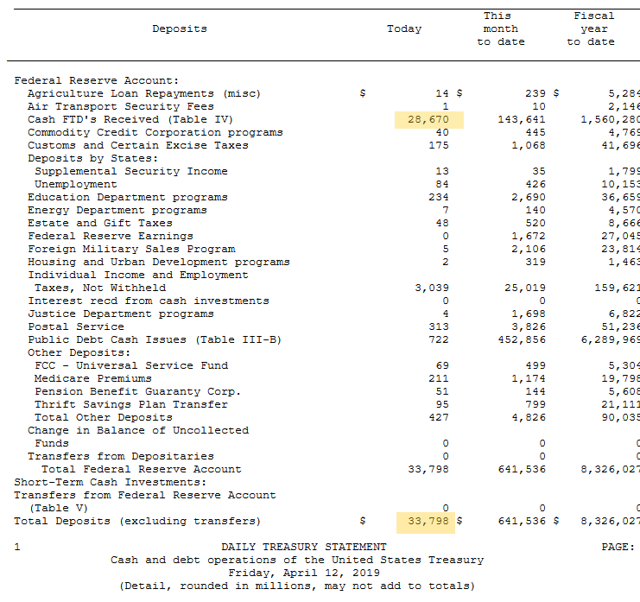
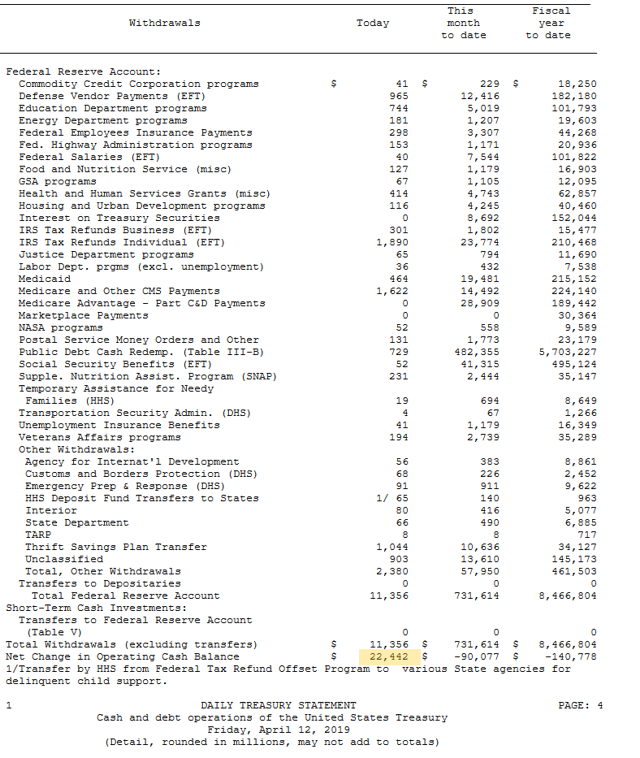
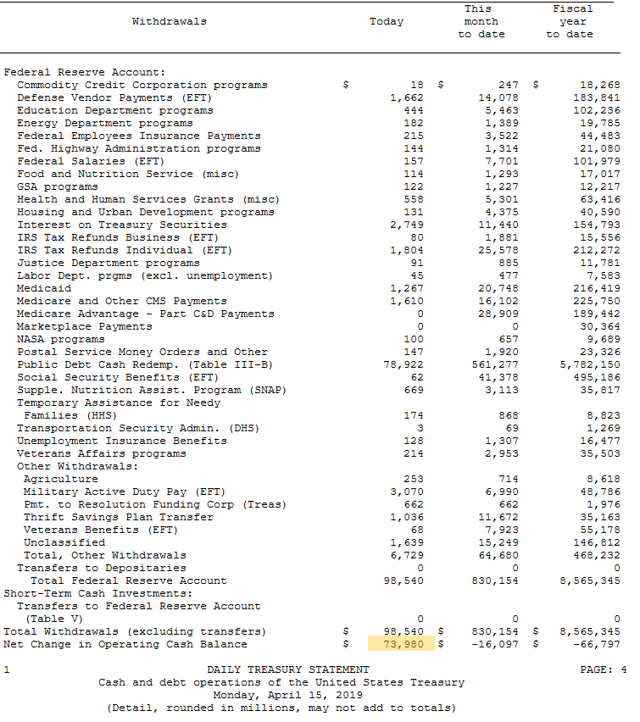
Recently, we have pointed out that Fiscal flows in the US during the latter half of the month of April could potentially put downward pressure on the stock market (all other variables being equal). Below are listed the deposits/withdrawals of the US Treasury for the dates April 11, 12, 15, and 16.
Notice how the Federal Tax Deposits (FTD) increase as we move down the calendar, and the Change in the Operating Cash Balance goes from a negative value of -$24B on April 11 (which means $24B was added to the economy) to a net increase of +$22B, +$73.9B, and +$38B on April 12, 15, 16, respectively (which means that $134B was removed from the economy in just 3 days).
April 11, 2019
(Click on image to enlarge)
(Click on image to enlarge)
April 12, 2019
(Click on image to enlarge)
(Click on image to enlarge)
April 15, 2019
(Click on image to enlarge)
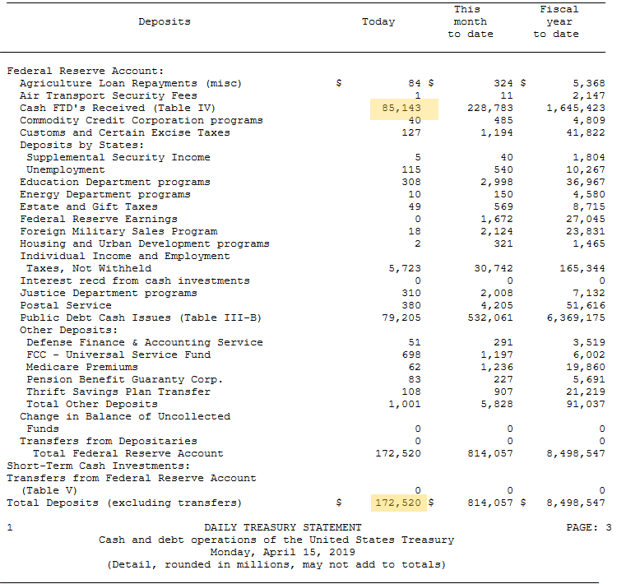
(Click on image to enlarge)
April 16, 2019
(Click on image to enlarge)
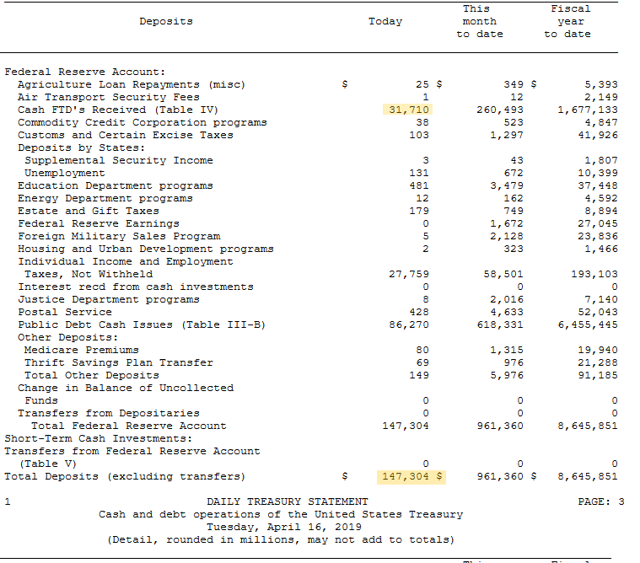
(Click on image to enlarge)
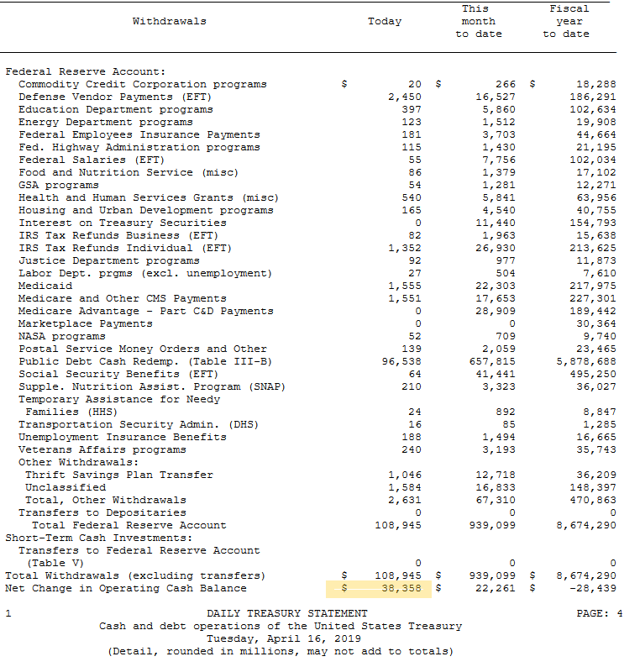
This withdrawal and cancellation of money from the economy takes a couple of weeks to show up in the stock market. We expect to see some weakness in stocks heading into May, but a resurgent rally after that as tax refunds start to be sent out.



Comments
Log in or sign up to join the conversation.