
US Dollar Price Volatility Report: DXY Index Breaches 98.00
US Dollar weakness has persisted for nearly 3 weeks. The DXY Index now trades below confluent support at the 98.00 handle after already cratering through major technical levels that have been outlined in the daily publishing of this US Dollar price volatility report. Recent bearish USD price action is threatening the greenback’s longstanding uptrend despite just printing fresh year-to-date highs earlier this month.
Though downside in the US Dollar has been largely attributable to counterpart strength as of late, this morning’s US retail sales data reinforced front-loaded expectations for Federal Reserve interest rate cuts, which helped push the DXY Index to its lowest level since September 13.
US DOLLAR INDEX PRICE CHART: WEEKLY TIME FRAME (OCTOBER 10, 2016 TO OCTOBER 16, 2019)
(Click on image to enlarge)
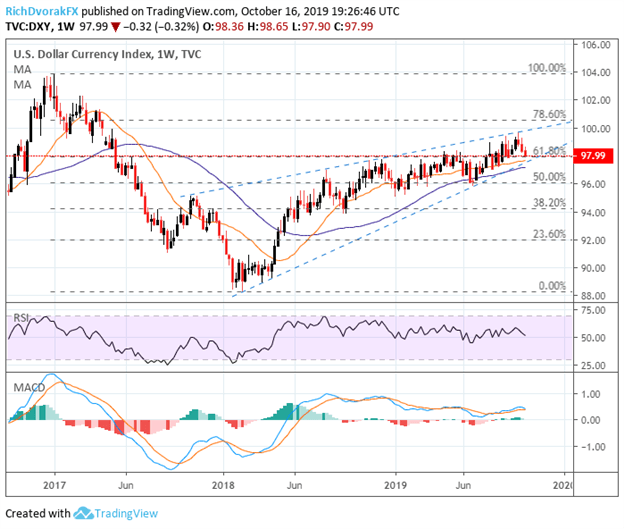
Chart created by @RichDvorakFX with TradingView
A weekly chart of the US Dollar brings to light the rising wedge chart pattern seemingly etched out by the DXY Index since mid-2017. Since the DXY Index breached its shorter-term bullish trendline revealed on a daily chart that connects the string of higher lows from June through September, the rising uptrend line extended from the lows recorded early last year and higher lows printed this past June now comes into focus.
A break below this longstanding bullish trendline could cause US Dollar selling pressure to accelerate quickly, but the world’s reserve currency will likely look to confluent support provided by the 61.8% Fibonacci retracement of the DXY Index’s trading range since January 2017.
US JOBS REPORT – INITIAL JOBLESS CLAIMS & CONTINUING CLAIMS
(Click on image to enlarge)
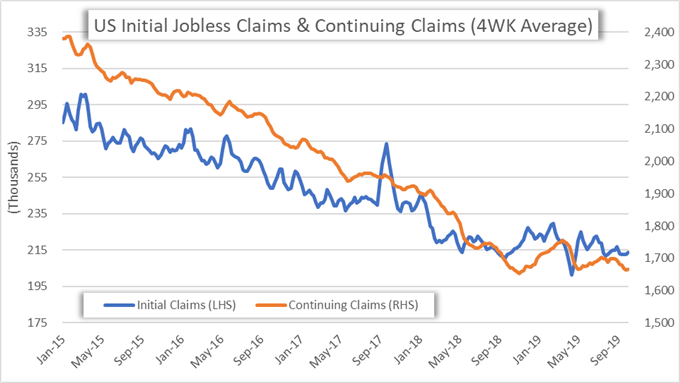
Though initial jobless claims data carries less weight than the closely watched nonfarm payrolls, the weekly figures can serve as a precursor to the headline NFP report. Signs of increasing stress experienced by the US labor market could exacerbate recent weakness exhibited by the US Dollar as it will likely bolster FOMC interest rate cut expectations. Aside from US jobs data slated for release Thursday at 12:30 GMT, the Federal Reserve’s Michelle Bowman and Charles Evans will be in the spotlight at 18:00 GMT as the central bankers are scheduled to speak at a ‘Fed listens’ event in Chicago.
FOMC INTEREST RATE CUT EXPECTATIONS (OCTOBER 2019)
(Click on image to enlarge)
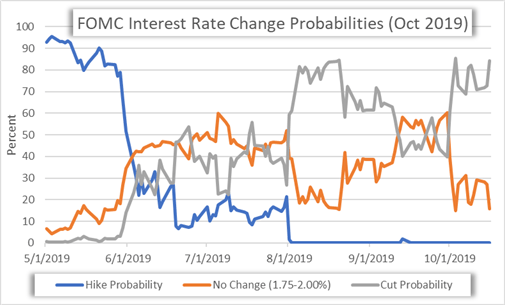
As mentioned previously, disappointing retail sales data released this morning propelled FOMC interest rate cut expectations. The probability of a 25-basis point interest rate cut later this month climbed from 72.8% yesterday to 84.2% today. Yet, several FOMC members have recently alluded to hesitation with regards to cutting the Fed’s benchmark interest rate for a third-straight policy meeting.
US DOLLAR IMPLIED VOLATILITY & TRADING RANGES (OVERNIGHT)
(Click on image to enlarge)
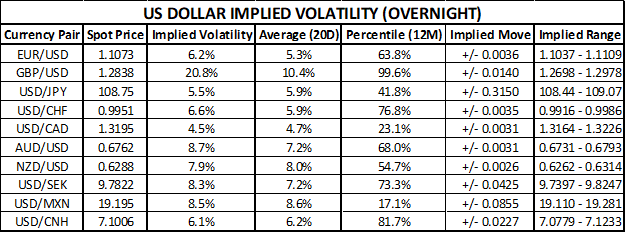
GBP/USD – The cable is once again expected to be the most volatile US Dollar currency pair as the UK and EU scramble to reach a Brexit deal.
AUD/USD – The Aussie is teed up for heightened volatility with Australian jobs data set to cross the wires at 00:30 GMT Thursday, which puts AUD/USD price action in focus.
USD/JPY – The Dollar-Yen is trading near month-to-date highs despite broader USD weakness revealed by the DXY Index. Keeping close tabs on this sentiment-geared and interest rate sensitive currency pair could provide a cleaner picture of US Dollar strength.


