
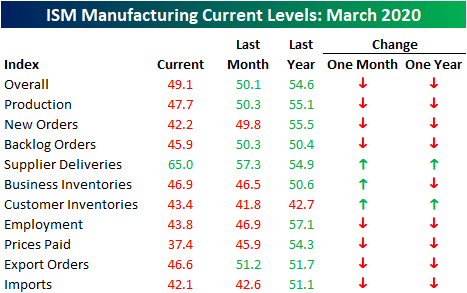
Under The Hood Weakness From ISM
As we have been highlighting over the past couple of weeks, soft manufacturing data for the month of March from regional Federal Reserve districts was horrendous with several record lows and record month over month declines. The ISM Manufacturing index for March was not nearly as bad. Forecasts were calling for the headline number to fall to 45 from 50.1 in February. That would have been the lowest level for the index since May of 2009. Instead, it only fell to 49.1 which is still a contractionary reading but much better than expected and actually 1.3 points above the December low of 47.8.
(Click on image to enlarge)

While the headline number has held up fairly well, under the hood this month’s report was not as strong. All but three categories fell in March, and the ones that rose are not positive signs. Supplier Deliveries, Business Inventories, and Customer Inventories all rose meaning products from suppliers are taking longer to reach manufacturers and existing inventories are not being drawn down on as they were previously. Additionally, whereas most readings were expansionary one year ago, now only Supplier Deliveries is, which again is not a positive sign.
(Click on image to enlarge)
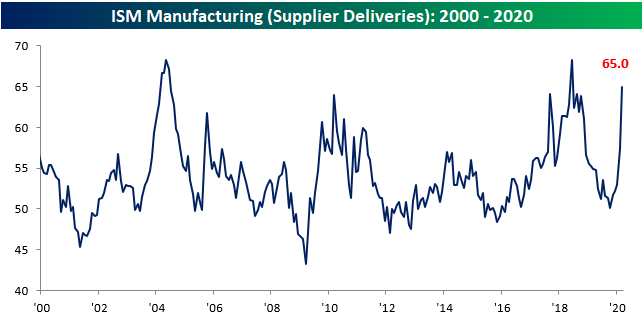
When the index for Supplier Deliveries is rising, this indicates that it is taking longer for manufacturers to receive products from their suppliers. This month, the index rose 7.7 points to 65 which is the highest level since June of 2018 when it reached 68.2. Of all readings since 1948, that is in the 89th percentile. That last time that the index rose by this much was nearly 15 years ago in September of 2005. Prior to that, you would need to go all the way back to 1988 to find a time that Supplier Deliveries rose by a larger amount.In other words, the shutdowns and slowdowns from COVID-19 are certainly beginning to disrupt supply chains.
(Click on image to enlarge)
(Click on image to enlarge)

Not only are supply chains taking a hit but so is demand. As we mentioned in Monday’s Closer, readings on new orders across other surveys have plummeted and the March ISM report is no exception. The index for New Orders fell 7.6 points to 42.2 in March. While that is not necessarily the sharpest decline in recent history (December of 2018 saw a larger decline of 8.7 points), New Orders is now at its lowest level since March of 2009.
(Click on image to enlarge)

Additionally, this month’s report has begun to show some of the adverse effects of COVID-19 on the labor market. The Employment component fell 3.1 points to 43.8 which is also the lowest level since the Spring of 2009.
(Click on image to enlarge)

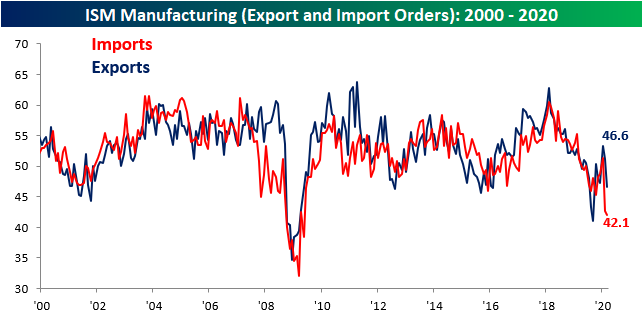
In last month’s report, we noted the record decline in imports. As could be expected, that decline continued in March, albeit at not nearly as dramatic a pace with the index for Imports falling slightly more to 42.1. That still leaves it at its lowest level since the financial crisis. Export orders, on the other hand, caught up with a sizable decline of their own. Exports fell 4.6 points to 46.6. That is the largest decline since last August and it also leaves it around similar levels to then. Either way, these two indices are pointing to an all-around slowdown of trade activity as a result of the coronavirus.
(Click on image to enlarge)
Start a two-week free trial to Bespoke Institutional to access our interactive economic indicators monitor and much ...
more

