
Ultimately, It’s All About The Stock Indices’ Phases
As those of you who have been with us for some time know, phases, both weekly and daily offer a reliable compass to gauge the market’s overall trend.
We have six. 
They are:
Bullish
Caution
Distribution
Bearish
Recuperation
Accumulation
These phases are measured by two simple moving averages-the 50 and 200.
We use them both on weekly and daily charts.
The relevancy for this moment in time is based on a few factors.
First, the current trading range with today’s move pushed most of the indices to the top of the trading range.
Secondly, none of the four indices changed phases today.
And thirdly, the economic modern family, except for Semiconductors, are all in negative phases.
Hence, the range and the disparity have created a choppy and volatile trading environment.
Let’s have a look.
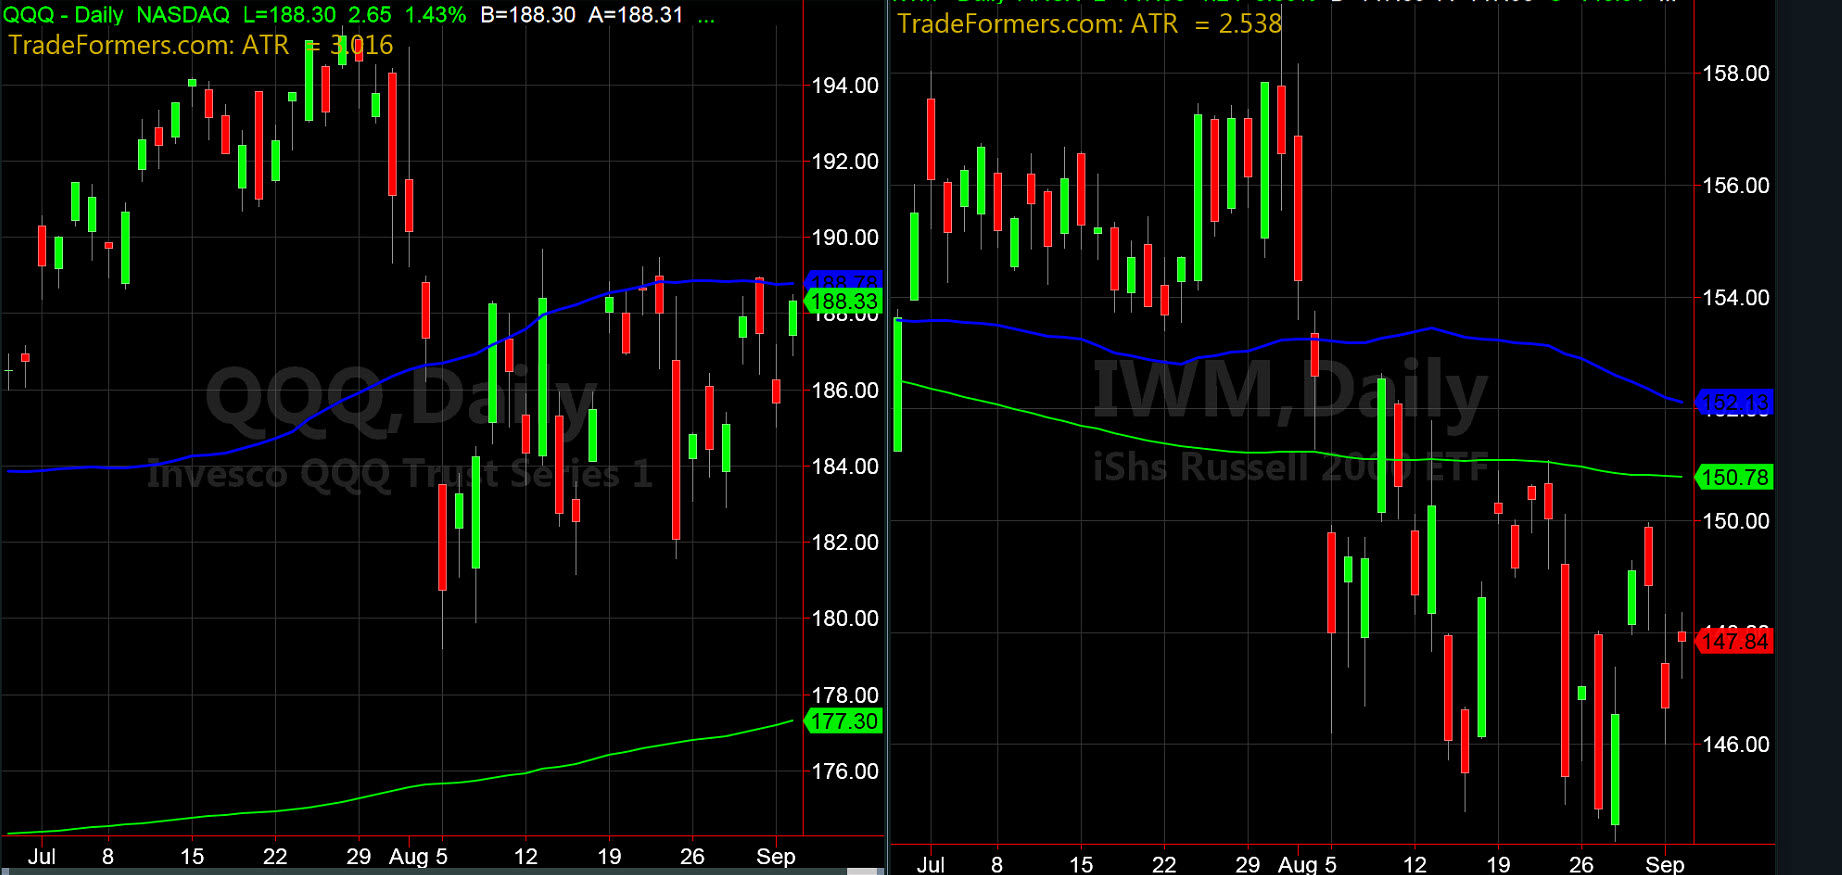
I show you both the Nasdaq 100 QQQ and the Russell 2000 IWM.
In the first scenario mentioned, we can see that QQQ trades near the top of the recent trading range. No surprise, it also had the biggest percentage gain of all the indices today.
Throughout August, the highest price QQQs traded was 189.68. Furthermore, on the weekly chart, QQQs are now working on a 3rd inside week. That means that the price action is narrowing, trading within the price action we have seen over the last 3 weeks.
Furthermore, until QQQs clear and confirms over the 50-DMA (blue line), the phase is caution.
The Russell 2000 IWM looks very different. For starters, the price is far from the top of its recent trading range. Plus, the current phase is distribution.
IWM has a lot of catching up to do. There have been numerous examples where IWM signals the end of a rally long before we see the price turn down in the tech arena or what we are seeing in QQQ.
Moreover, in the economic modern family (the Russells IWM, Retail XRT, Regional Banks KRE, Transportation IYT, Biotechnology IBB, and Semiconductors SMH), the disparity is culpable.
Only SMH is in a bullish phase. The others, besides IWM, are all in bearish phases.
That tells us that in spite of a strong tech and NASDAQ performance, the underlying damage and potential future of the US economy continues to flash a big warning.
What would make that change?
We need to see both some unity among the economic modern family and more positive phase changes.
S&P 500 (SPY) Watch this carefully. 294 is the 50-DMA to clear and confirm. A gap above tomorrow could be worth a good daytrade at least. 290 is max risk
Russell 2000 (IWM) 148.00 the pivotal area failed. A move back above is positive. If it cannot hold above that level, selling pressure remains
Dow (DIA) 265.60 is the 50-DMA. 260 major support to hold
Nasdaq (QQQ) The 3rd inside week. That makes last week’s range super important. Above 188.97 stronger and below 182.91 weaker. 188.80 is the 50-DMA. I’d follow the range break either way
KRE (Regional Banks) 49.50 pivotal resistance to clear. 47.98 support.
SMH (Semiconductors) 113.45 the 50-DMA area cleared for an unconfirmed bullish phase. Plus it took out the August trading range. Precursor for the others to follow? Remains to be seen
IYT (Transportation) 182 first pivotal area then 179.50. Plus this has to clear 185.45 for more than one day.
IBB (Biotechnology) the 200 WMA at 102.71 pivotal area failed. But 100 has served as good support.
XRT (Retail) This has multiple bottoms around 38. Now needs to clear 40.00 and then we shall see what it has.
*BONUS-EWW (Mexico) Looks like a huge double bottom on the weekly charts. Unconfirmed recuperation phase with a weekly close over 42.07 positive
Disclosure: None.
If you'd like more information about the additional free trading education ...
more

