
Typical Returns For Conservative Hedged Portfolios

The disassembled Soloflex (photo via author).
An Atypically High Return
Near the end of a previous post (The Soloflex Economy), I showed a portfolio hedged against a >4% decline that had generated a 9.84% return. That return was atypically high for a portfolio that conservative. Our hedged portfolio method is still a good approach for conservative investors who want higher returns than cash, but it's not that good. Let me give you a fuller picture of how these portfolios typically perform. First, a bit of background.
The Hedged Portfolio Method
The basic idea here is to buy a handful of names we estimate will generate positive returns over the next 6 months, net of hedging costs, and hedge them in the event that we're wrong. Our universe starts with nearly every stock and ETF with options traded on it in the U.S. - about 4,000 names in total - but that universe gets smaller as you limit it to names that are hedgeable against smaller declines. For example, as of Thursday's close, there were only 77 securities which were hedgeable against >4% declines over 6 months and which we estimated would post returns greater than their hedging costs over that time frame.
The Atypical Portfolio
In my previous post, I mentioned that this portfolio hedged against a >4% decline had been created by our site 6 months earlier, on October 31st of last year (each portfolio created by the site is designed to last 6 months):
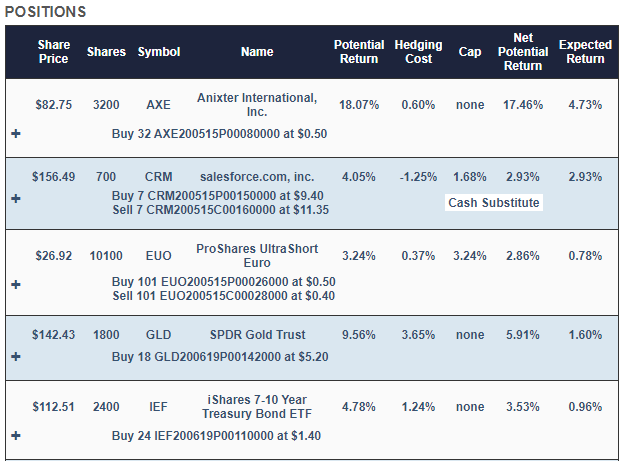
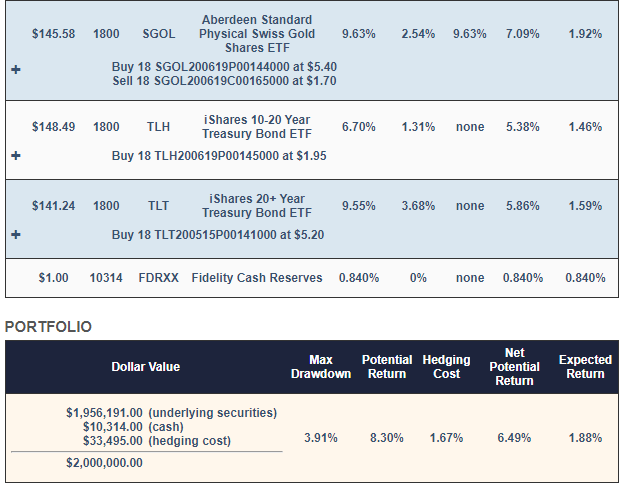
The only stocks in that portfolio were Anixter International (AXE), which had just been acquired by Wesco (WCC), and Salesforce (CRM). The rest were fixed income and precious metals ETFs, such as the iShares 20+ Year Treasury Bond ETF (TLT) and the SPDR Gold ETF (GLD).
When generating these portfolios, the site aims to maximize your expected return while strictly limiting your risk according to the level you indicate. The worst case scenario for the portfolio above - even if every underlying security went to zero before its hedge expired - was a decline of 3.91%. The expected return was 1.88%, but as it happened, the portfolio performed much better:
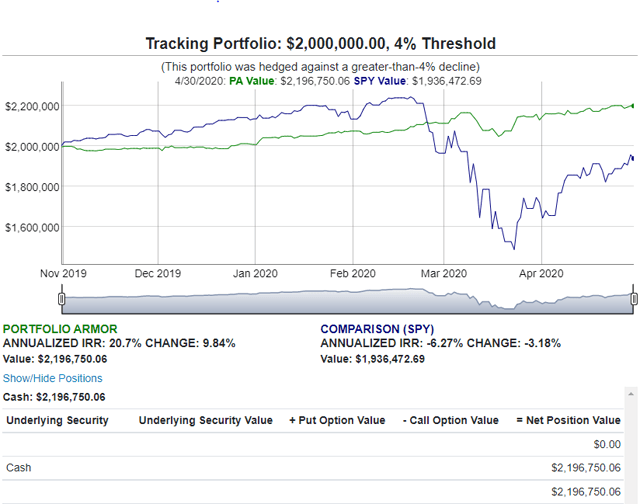
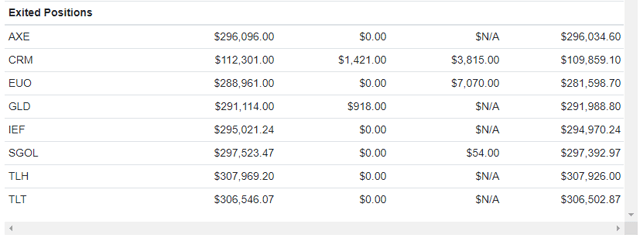
So this portfolio ended up 9.84% (net of hedging and trading costs), while the S&P 500 tracking ETF (SPY) was down 3.18% over the same time frame.
Most Portfolios Hedged This Way Don't Do That Well
So far, we have full, 6-month performance data for 18 portfolios hedged against >4% declines, and although 17 of them have posted positive returns, as you can see in the table below, none has come close to the performance shown above. If you click on a starting date, it will take you to an interactive chart for that portfolio.
Portfolios Hedged Against >4% Declines
| Starting Date | Expected Return | Actual Return | SPY Return |
|---|---|---|---|
| May 9, 2019 | 1.86% | 2.03% | 8.80% |
| May 30, 2019 | 1.83% | 5.70% | 13.72% |
| July 11, 2019 | 3.36% | 3.72% | 9.86% |
| July 25, 2019 | 2.48% | 3.68% | 10.64% |
| August 1, 2019 | 3.68% | 2.55% | 10.16% |
| August 8, 2019 | 3.21% | 1.75% | 14.22% |
| August 15, 2019 | 1.77% | 0.36% | 19.74% |
| August 22, 2019 | 3.08% | 3.07% | 15.15% |
| August 29, 2019 | 2.78% | 1.73% | 2.23% |
| September 5, 2019 | 2.58% | 4.19% | 2.55% |
| September 12, 2019 | 2.42% | 2.71% | -16.86% |
| September 29, 2019 | 1.32% | 1.88% | -13.26% |
| October 3, 2019 | 1.83% | -0.13% | -13.60% |
| October 10, 2019 | 1.44% | 1.98% | -4.08% |
| October 17, 2019 | 1.51% | 4.30% | -3.16% |
| October 24, 2019 | 1.64% | 1.97% | -4.75% |
| October 31, 2019 | 1.87% | 9.84% | -3.18% |
| November 7, 2019 | 4.03% | 3.88% | -5.62% |
| Average | 2.37% | 3.07% | 2.36% |
Note that the average actual return for these portfolios has exceeded the average return of SPY over the same time frames - I wouldn't expect that to continue in a bull market, but the average return for this approach is still solid relative to the risk taken.
You can read more about the hedged portfolio process here.


