
Two S&P 500 Sectors Have A Rising FCF Yield Through 1H20
This report analyzes[1] free cash flow (FCF), enterprise value and the FCF yield for the S&P 500 and each of its sectors.
S&P 500 FCF Yield Falls to Lowest Level Since December 2009
FCF yield for the S&P 500 fell from 1.8% at the end of 2019 to 0.8% through 2Q20, or its lowest level since December 2009. See Figure 1. Only two S&P 500 sectors saw an increase in FCF yield since the end of 2019, as we’ll show below.
Figure 1: TTM FCF Yield for the S&P 500 From December 2004 – 8/11/20
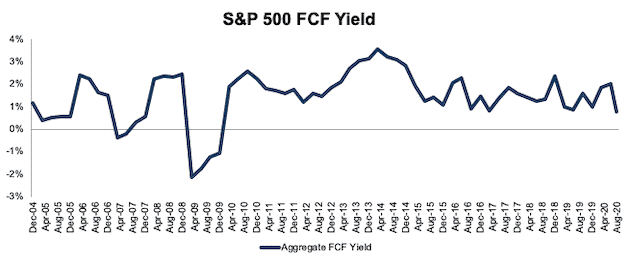
Sources for this and all subsequent charts: New Constructs, LLC and company filings.
Ranking the S&P 500 Sectors by FCF Yield
Figure 2 ranks all 11 S&P 500 sectors by change in FCF yield from the end of 2019 to 8/11/20.
Figure 2: TTM FCF Yield as of 8/11/20 by Sector
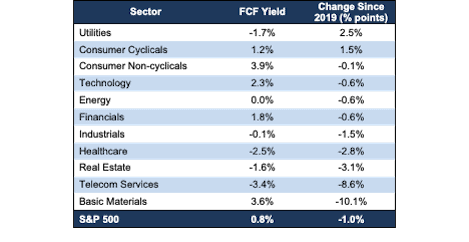
Investors are getting more FCF for their investment dollar in the Consumer Non-cyclicals sector than any other sector. On the flip side, the Telecom Services sector currently has the lowest FCF yield of all S&P 500 sectors.
Only the Consumer Cyclicals and Utilities sectors have seen an increase in FCF yield since the end of 2019.
Details on Each of the S&P 500 Sectors
Figures 3-13 show the FCF yield trends for every sector since 2004.
We present the components of FCF yield, FCF and enterprise value, for the S&P 500 and each S&P 500 sector in Appendix I.
Appendix II provides additional aggregated FCF yield analyses that adjust for company size/market cap.
Basic Materials
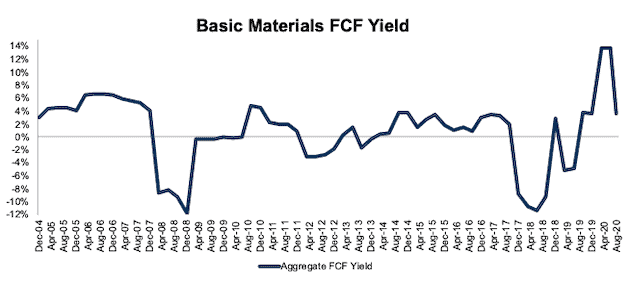
Figure 3 shows the FCF yield for the Basic Materials sector increased significantly since mid-2018 even after the COVID-19 induced downturn in 2020. The Basic Materials sector FCF fell from $106 billion at the end of 2019 to $35 billion TTM while enterprise value increased from $778 billion to $966 billion over the same time.
Figure 3: Basic Materials FCF Yield: December 2004 – 8/11/20
Consumer Cyclicals
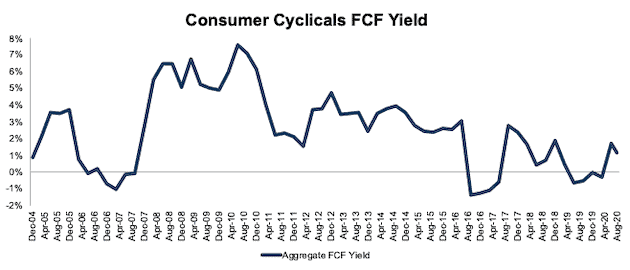
Figure 4 shows the FCF yield for the Consumer Cyclicals sector has mostly been in a long-term decline since 2010. The Consumer Cyclicals sector FCF improved from -$12 billion at the end of 2019 to $61 billion TTM while enterprise value increased from $3.9 trillion to $5.3 trillion over the same time.
Figure 4: Consumer Cyclicals FCF Yield: December 2004 – 8/11/20
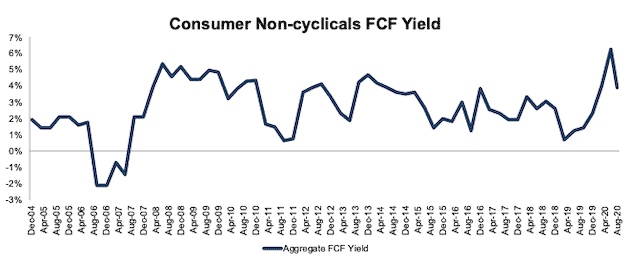
Consumer Non-cyclicals
Figure 5 shows FCF yield for the Consumer Non-cyclicals sector soared in 2019 before falling to 3.9% TTM. The Consumer Non-cyclicals sector FCF improved from $101 billion at the end of 2019 to $111 billion TTM while enterprise value increased from $2.5 trillion to $2.8 trillion over the same time.
Figure 5: Consumer Non-cyclicals FCF Yield: December 2004 – 8/11/20
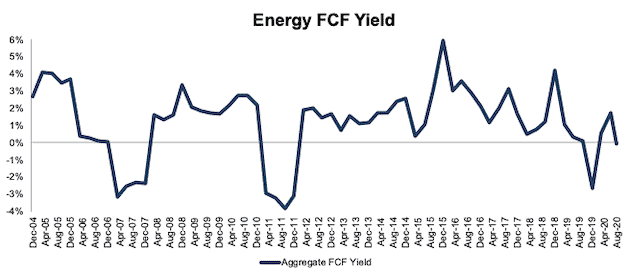
Energy
Figure 6 shows the volatile nature of the FCF yield for the Energy sector. The Energy sector’s FCF yield fell from 0.6% at the end of 2019 to -0.05% TTM. The Energy sector FCF declined from $6 billion in 2019 to -$623 million TTM and enterprise value increased from $1.1 trillion to $1.3 trillion over the same time.
Figure 6: Energy FCF Yield: December 2004 – 8/11/20
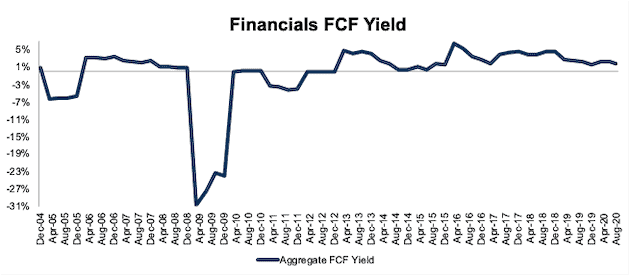
Financials
Figure 7 shows FCF yield for the Financials sector has been largely stable except during the Financial Crisis. The Financials sector FCF yield declined from 2.4% at the end of 2019 to 1.8% TTM. The sector’s FCF declined from $75 billion in 2019 to $64 billion TTM while enterprise value increased from $3.2 trillion to $3.7 trillion over the same time.
Figure 7: Financials FCF Yield: December 2004 – 8/11/20
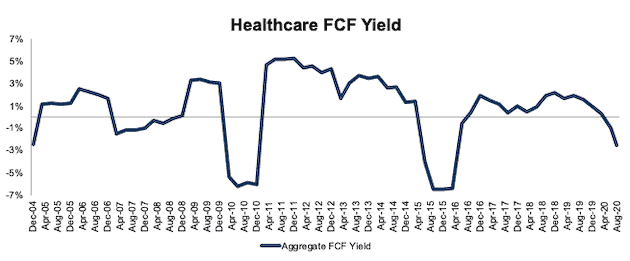
Healthcare
Figure 8 shows FCF yield for the Healthcare sector fell from 0.3% at the end of 2019 to -2.5% TTM. The decline in FCF yield stems from FCF falling from $10 billion in 2019 to -$117 billion TTM. Meanwhile, enterprise value increased from $3.9 trillion to $4.7 trillion over the same time.
Figure 8: Healthcare FCF Yield: December 2004 – 8/11/20
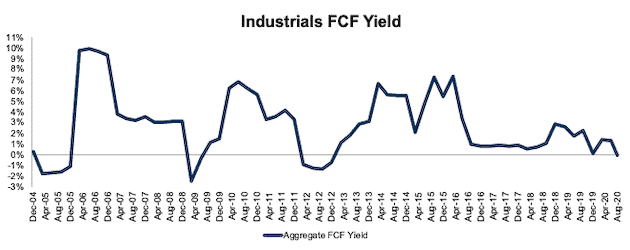
Industrials
Figure 9 shows FCF yield for the Industrials sector sits at -0.1%, which is the lowest level since 2012. The Industrials sector FCF fell from $41 billion in 2019 to -$3 billion TTM while enterprise value increased from $2.9 trillion to $3.6 trillion over the same time.
Figure 9: Industrials FCF Yield: December 2004 – 8/11/20
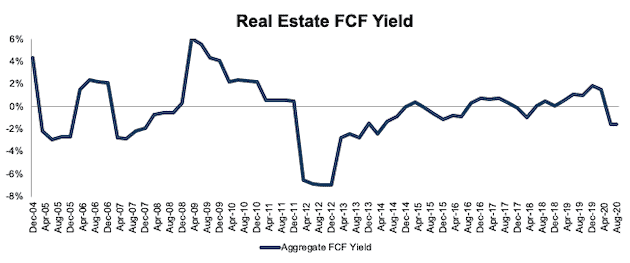
Real Estate
Figure 10 shows the FCF yield for the Real Estate sector rather steadily improved from 2012-2019 before falling in 2020. The Real Estate FCF yield fell from 1.5% in 2019 to -1.6% TTM. FCF for the sector fell from $13 billion in 2019 to -$15 billion TTM and enterprise value increased from $869 billion to $984 billion over the same time.
Figure 10: Real Estate FCF Yield: December 2004 – 8/11/20
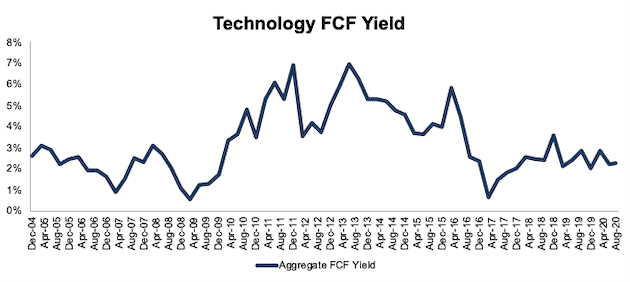
Technology
Figure 11 shows the FCF yield for the Technology sector remains well below prior highs in 2011, 2013, and 2015. The sector’s FCF yield fell slightly from 2.8% in 2019 to 2.3% TTM. The Technology sector FCF increased from $199 billion in 2019 to $220 billion TTM and enterprise value improved from $7.0 trillion to $9.7 trillion over the same time.
Figure 11: Technology FCF Yield: December 2004 – 8/11/20
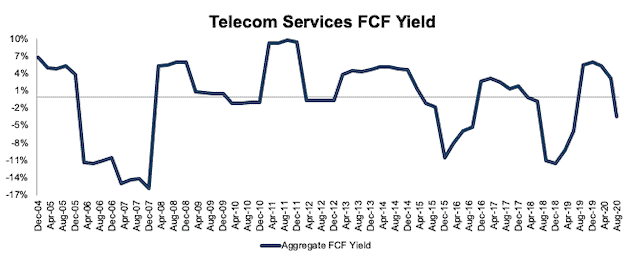
Telecom Services
Figure 12 shows the FCF yield for the Telecom Services sector has fallen from 5.3% in 2019 to -3.4% TTM. The sector’s FCF fell from $59 billion in 2019 to -$42 billion TTM and enterprise value increased from $1.1 trillion to $1.3 trillion over the same time.
Figure 12: Telecom Services FCF Yield: December 2004 – 8/11/20
Sources: New Constructs, LLC and company filings.
Utilities
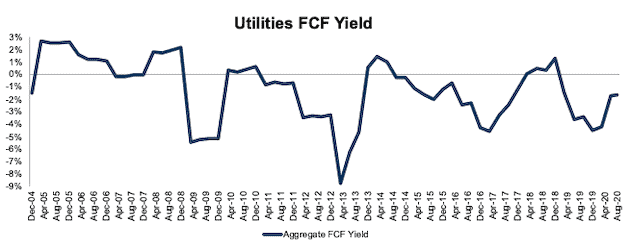
Figure 13 shows the FCF yield for the Utilities sector is rather consistently negative and, despite improving since its 2019 lows, remains negative at -1.7%. The Utilities sector’s FCF improved from -$66 billion in 2019 to -$28 billion TTM while enterprise value increased from $1.6 trillion to $1.7 trillion over the same time.
Figure 13: Utilities FCF Yield: December 2004 – 8/11/20
For reference, we analyze the core earnings for the entire S&P 500 in “S&P 500 Peaks As Earnings Trough” and for each S&P 500 sector in “Only One S&P 500 Sector’s Core Earnings Improved This Year.” We analyze ROIC and its drivers in “No S&P 500 Sector Has a Rising ROIC Through First Half 2020.”
These reports leverage cutting-edge technology to provide clients with a cleaner and more comprehensive view of every measure of profits[2]. Investors armed with our research enjoy a differentiated and more informed view of the fundamentals and valuations of companies and sectors.
Disclosure: David Trainer, Kyle Guske II, and Matt Shuler receive no compensation to write about any specific stock, style, or theme.


