
Tops Are No Less A Process Than Bottoms
Alright folks, let's get this party started! It's hard to suggest anything bad, poor or plain ole crappy took place in the markets last week, given most everything finished higher and with certain of the major indices finishing at record highs. Take a gander at the following chart from Charlie Bilello and suggest anything to the contrary of what I stated, go ahead; I dare you!
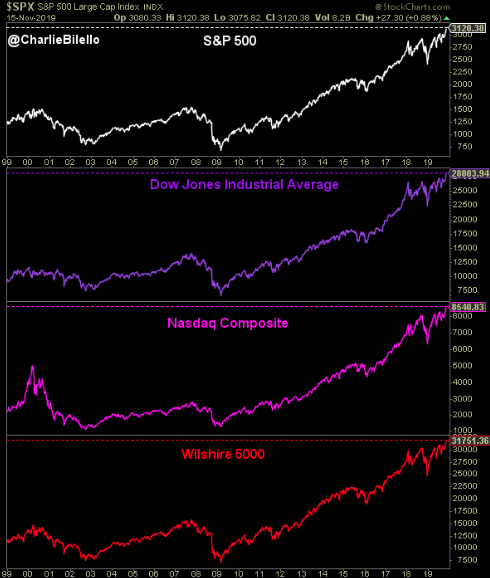
- S&P 500: All-Time High (above 3,100 for first time)
- Dow: All-Time High (above 28,000 for first time)
- Nasdaq: All-Time High
- Wilshire 5000: All-Time High
In keeping with the theme that it is a good idea to review ALL of the data, an investor should not underestimate the signal that global stocks are sending. It is a significant event when all the markets around the world are rising, and it means that the strength in the U.S. market is not alone. It is a powerful sentiment and statement that markets are sending, so don't overlook or discount it, in my opinion.
When we strip away all of the rhetoric, the worries, complaints, and questions, the current bull market has followed in the footsteps of many others. It shows resilience and presents a picture that strength begets more strength. Bull markets don't wither away and die on the vine because they have been around too long. Instead, they will eventually reach a crescendo. The boom if you will before there is any bust. It is similar to the economic cycle.
But what about market breadth/internals. Unlike the last couple of weeks, most breadth/internals turned higher, retracing prior weeks' losses and further confirming the strength of the bull market. What do I really like about what we're seeing in breadth or MOMENTUM, as I might prefer more recently? Well, I'll "tell ya what I like, what I really really like" (Spice Girls, more to come). As I discussed in the previous week, the MACD turn higher from late July gave us increasing confidence in the bull market to continue beyond July. Even though this confidence was tested with a pullback in the S&P 500 for August, MACD combined with the general macro-fundamentals proved the bull market thesis was in-tact. So now let's look at the S&P 500 chart combined with the MACD at the bottom of the chart
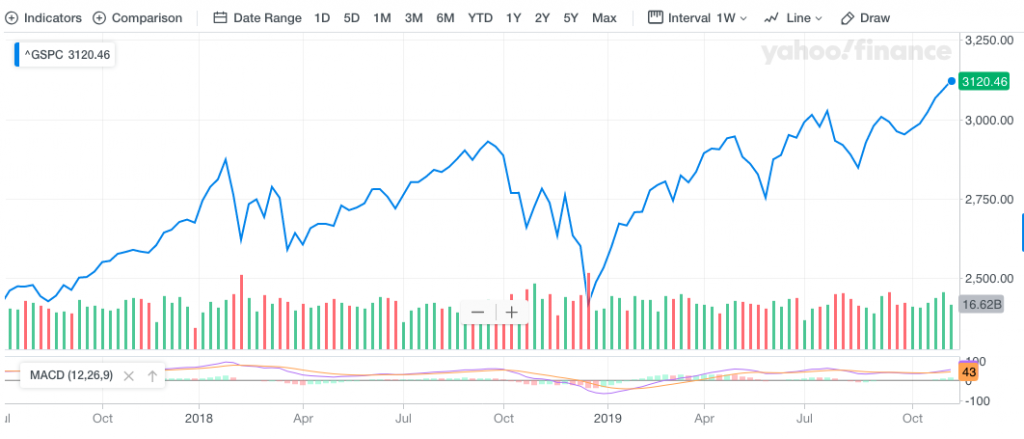
The two lines in the MACD momentum are hard to see from this depiction above, so let me narrow it in to identify the really happy place in the forecast for the S&P 500. With this past week's record closing Friday action, we see that the MACD (purple) has remained above the signal (orange) and is starting to separate from the signal line once again, a net positive for bulls longer-term. But this is also something that happens ahead of market exhaustion and a subsequent rest/drawdown in the market. So just be aware and know any drawdown is what, that's right; it is a buying opportunity.

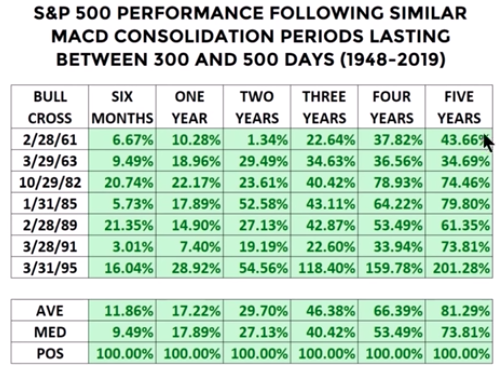
And since we're talking about MOMENTUM and long-term vision, it's important to keep in mind that we may very well be within an entirely new bull market. Of course, this will take the shape of fact or opinion depending on whom you ask. Recall that the S&P 500 peak to trough decline in Q4 2018 was 19.8%, with a formal definition of a bear market constituting at least a 20% peak to trough decline. Are we really going to mince definitions by .2% to suggest that wasn't a technical bear market? Again, it depends on whom you ask? Even so, since early 2018 or 18 months, the bull market did little to nothing and unless you count digesting gains. The market had been in a sideways, choppy, consolidating pattern until October's breakout, as shown in the following chart by Ciovacco Capital:

The S&P 500 had tested its 200-WMA back in December 2018. It proved a successful test for which the 2019 rally might seem overdone but has historically provided investors with significant gains out some 5 years, when combined with a MACD turn higher.
While the long-term signals suggest the probable returns are favorable, investors should recognize that history does not always repeat and anything is probable. We do ourselves a disservice when we work against the probabilities, but we also do ourselves a greater disservice if we wholly rely on historic market performance. In many ways, this bull market is unlike that of past bull markets. As such, we should at least expect certain outcomes to differ from the past.
Internals, internals, internals, breadth, breadth, breadth... so let's check it out! The S&P 500 RSI (Relative Strength Index) moderated higher on the week, which is a net positive for momentum, but it's also nearing a peak level. More importantly, is participation when it comes to breadth. For this, we take a look at the percentage of stocks trading above their respective moving averages. Firstly let's take at the percentage of stocks trading above their 50-DMA and then their 20-DMA.
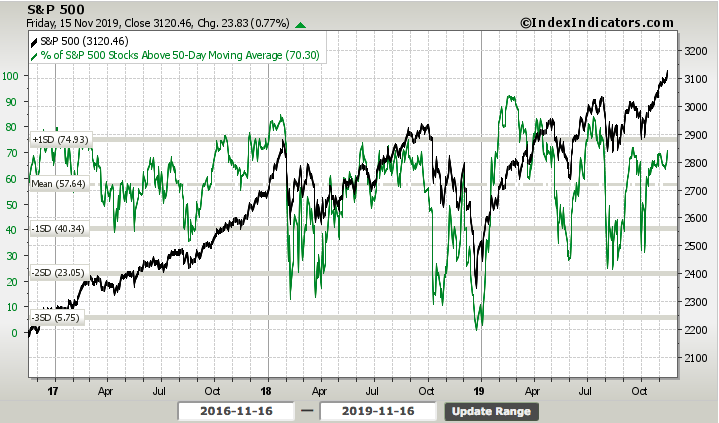
With an end-of-week reading of 70.30, the percentage of stocks trading above their 50-DMA moved nicely higher WoW from 65. Now let's take a gander at the percentage of stocks trading above their 20-DMA. You can probably guess that this breadth indicator also moved higher on the week.

Exactamundo! The percentage of stocks trading above their 20-DMA moved up from roughly 66 in the previous week to slightly above 69 this past trading week. And yes, I could quite literally blow through 30 other breadth indicators/internals to largely come across the same thing, improving breadth that coincides with a strong strong weekly gain of .9% for the S&P 500. The bigger takeaway at this point is simply to look back at the previous weakening of breadth to suggest the following:
- Market breadth/internals are something we should study and define for probabilities going forward
- However, breadth can shift with headlines in either direction, just like the overall market itself
- Approaching or achieved record highs demand a study of breadth in order to confirm or deny a rally/bullish trend to new highs.
- At the end of the day, our longer-term internals/momentum indicators are priority i.e. S&P 500 200-WMA, NYSE A/D Line and MACD
So why don't we take a look at the NYSE A/D (advance/decline) line against the S&P 500. The chart below does show some divergence, although it's nothing to be alarmed about. The steady, new NYSE A/D line highs over the last several months have foreshadowed new highs in the S&P 500, something I talked about in previous Research Reports. (S&P 500 top chart, NYSE A/D line bottom chart)
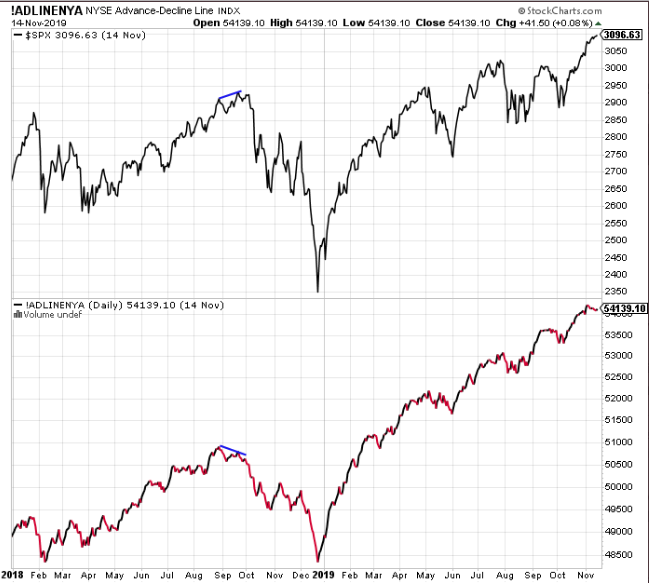
Taking the NYSE A/D line and pairing it with the S&P 500 new highs minus new lows is a net negative at the moment and to end the prior trading week. I think what the two generally identify is a bit of market exhaustion ahead. But if the geopolitical headlines have anything to say about it, as they usually do... (SPX new highs minus new lows declined from 62 to 57 this past week).

Ok so those two charts suggest near-term market exhaustion to one degree or another, but overall I like what I'm seeing in the way of broadening market performance. This is characterized by a more offensive posture taken in the markets. Market character changed over the last 6 weeks as the Russell 2000 ETF (IWM) surged and actually outperformed the S&P 500. The Russell has been up roughly 4.8% over the last month while the S&P 500 has been up 4.17 percent. Even though the small-cap index ETF (IWM) is not “outperforming”, small-caps are getting their groove on and it looks like the bull market is definitely broadening. But, but, but wait... it gets better!
Not only is the S&P 500 ETF (SPY) hitting a new high and in a long-term uptrend, but it is also outperforming the 20+ Yr Treasury Bond ETF (TLT) again. Stocks represent risk assets and bonds represent safe-haven assets. The market embraces risk when stocks outperform and turn risk-averse when bonds outperform. Given this definition, the offense has taken the field!
The chart below shows SPY hitting new highs in October and trading well above its rising 50-day SMA. In contrast, TLT formed a lower high in early October and exceeded its September low earlier this month. TLT is also below its falling 50-day SMA. Money is moving out of safe-haven bonds.

Enlarge your screen to read any of the charts. The bottom window shows SPY's relative performance to TLT using a ratio chart (_SPY:_TLT). This risk ratio formed a higher low from August to October and broke above its September high. Risk is clearly “on” because riskier assets (stocks) are outperforming safe-haven assets and the market is otherwise sending us another longer-term signal.
In terms of risk appetite, I also desired to see offensive/cyclical sectors outperform defensive sectors of the market. Over the last few weeks, this is definitively what has taken shape. Recall from only 5 weeks ago that Canaccord Genuity's chief market strategist Tony Dwyer stated it was time to get offensive with your portfolio allocations.

Well, since then Technology, Finance, Industrials, and Healthcare are leading with the biggest gains. Three of these sectors are offensive sectors and Healthcare is the second biggest sector in the S&p 500. Together, these four account for 59% of the S&P 500. In contrast, money moved out of Utilities, Consumer Staples and Real Estate. These defensive sectors are underperforming over the stated time period. But don't count them out. There may still yet be a bull market into year-end that finds these sectors playing catch up.

In recognizing what took place in the market last week, I have to admit that headlines once again ruled the day. For much of the trading week, the market went absolutely nowhere. In fact, .77% of the S&P 500's weekly .89% gain came on one single day, Friday. What moved markets from Thursday evening through Friday's trading session was another trade headline.
Heading into the week, there has been increasingly positive sentiment surrounding the current trade truce and ongoing negotiations that are aimed at a phase 1 trade deal. On Thursday evening a headline broke suggesting that the U.S. and China were that much closer to signing a deal.
"The United States and China are getting close to a trade agreement, White House economic adviser Larry Kudlow said on Thursday, citing what he called very constructive talks with Beijing about ending a 16-month trade war.
The mood music is pretty good, and that has not always been so in these things. It’s not done yet, but there has been very good progress and the talks have been very constructive."

Trade optimism is feeding through playing out well with investors, but long-term we're going to need to see increased economic activity. To date, we've seen nothing but slowing growth with some green shoots pointing to a re-acceleration of growth into 2020, but until it materializes I'll remain cautiously optimistic with my capital outlays. How about you?
In reviewing where the S&P 500 finished the week, wouldn't you know it...right on top of the weekly expected move. The S&P 500's weekly expected move was just shy of 28 points and the S&P 500 moved and finished exactly at that mark of 3,100 from the closing price of 3,093 in the previous trading week. For the week to come, the S&P 500 weekly expected move has moderated higher to $32/points.
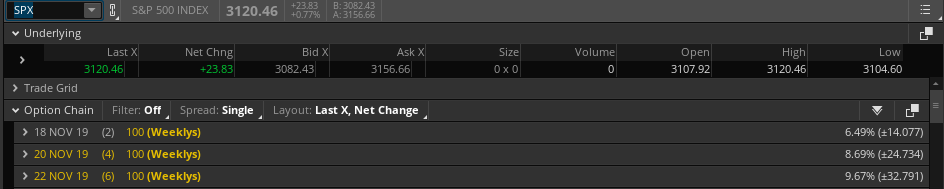
Usually, with the market moving higher on the week, implied volatility (VIX) moves lower, and it did, but only by .17 percent. Market participants are now pricing in a greater market move than in the previous week and suggesting an increase in volatility may be accompanying this move.
Many traders have been forecasting a market pullback for the last 3 weeks. With the S&P 500 up 6 straight weeks and remaining with extreme bullish sentiment and overbought conditions, it's hard to argue that a pullback doesn't appear imminent. Nonetheless, until it arrives, your winners are your friends and the long-term market outlook remains bullish. Any near-term market disruptions will likely prove temporary buying opportunities, so don't like that "gift horse in the mouth" and "shut up and drive"!
Weekly Economic Data
The economic data calendar was light once again in the past trading week. I don't particularly care about the inflation reports at this stage of the economic cycle and mainly because it has proven impossible to stoke any means of serious and sustainable inflation in the economy over the last 40 years or so. "Enter the Dragon" (Bruce Lee reference) that is Amazon (AMZN) and the invent of the information technology era and the consumer has taken over the asylum if you catch my drift. The consumer has pricing power, not corporations and not the government. Can you find a way to put the horseback in the barn, because I can't. Nonetheless and for the sake of thorough report, fine...
The consumer price index (CPI) jumped 0.4% in October, with energy accounting for more than half the increase, the government said Wednesday. Economists polled by MarketWatch had forecast a 0.3% advance.

The increase in the cost of living over the past 12 months edged up to 1.8% from 1.7%, but it’s still well below last year’s peak of nearly 3 percent. Another closely watched measure of inflation that strips out food and energy advanced 0.2% last month. The yearly increase in the so-called core rate slipped to 2.3% from 2.4 percent.
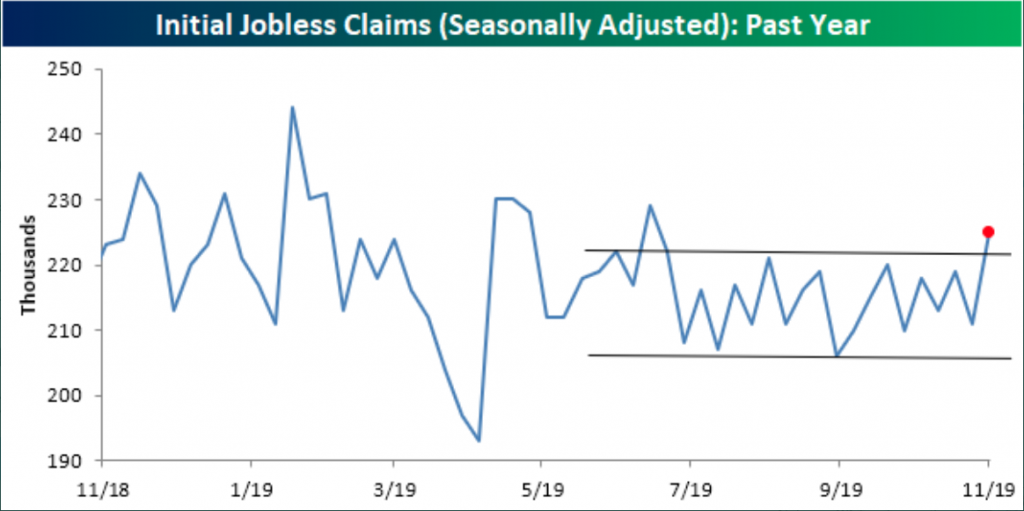
There bored and done with CPI. On to weekly Initial Jobless Claims. Unfortunately, we saw a breakout from a recent range when the data was reported last Wednesday. Initial jobless claims rose 14,000 to a seasonally adjusted 225,000 in the seven days ended Nov. 9, the government said Thursday. That’s the highest level since late June. (Charts from Bespoke Investment Group)
The monthly average of new claims nationwide, meanwhile, rose a lesser 1,750 to 217,000. The 4-week average gives a more stable view of the labor market than the more volatile weekly number. At 217,000, the moving average is now the highest since July 12th when it was 218,750. Despite this move higher, unlike the seasonally adjusted number, this increase did not break the moving average out of its recent range.
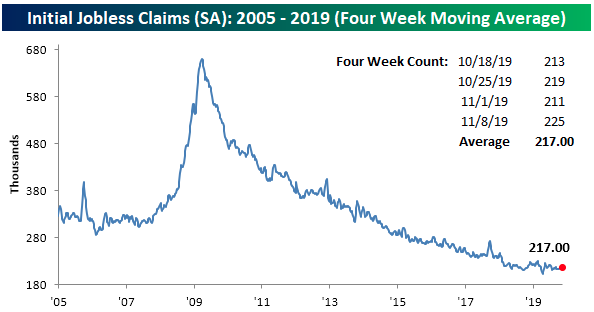
Ahead of the holiday spending season, I'd certainly rather see a better series of employment data than that which was delivered this past week, but it's still not something of concern. I will need to see jobless claims sustain upward moves for several weeks before suggesting something is becoming a cause for concern. Just not there presently.
The most important piece of economic data for the week was arguably the monthly retail sales report, which came in slightly better than economists' forecasts. Retail sales increased 0.3% last month, the government said Friday, beating the forecast of .2% polled by Reuters. There was no revision to the previous month.
Most of the sales gains were reaped by auto dealers, gas stations and internet/Non-store retail sales.

Most other retailers posted soft results just before the start of the critical holiday shopping season. If autos and gasoline are excluded, sales rose a scant 0.1 percent. When further scrutinizing the monthly sales report we come to find that annualized retail sales growth has cooled ahead of the holiday period. In October, YoY retail sales grew 3.1%, slowing from roughly 4% in the past few reporting periods. Is this a concern? Honestly, it is and it isn't. Look at a longer-term chart of retail sales below from Advisor Perspectives, I suggest this is a normal slowing pattern until proven otherwise.
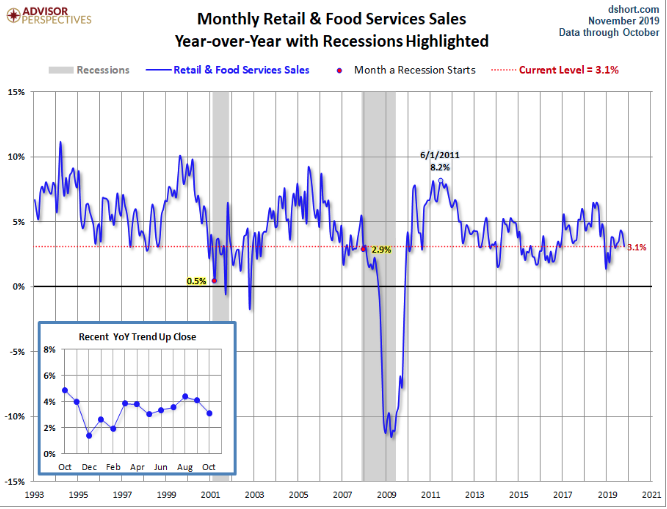
Annualized retail sales growth has been above and below the 3% line throughout the current expansion cycle. For each period that annualized retail sales topped 4% for any calendar year/s, it spent time below 4% in the following calendar year. The more time annualized retail sales grow above trend, 4-6%, the more time they spend below trend in the out years. For 2018, annualized retail sales grew at their fastest pace (>5%) since 2011. As such, it should come as no surprise that retail sales have grown at a slower pace in 2019 and post the tax reform stimulus. What we're seeing in retail sales are the signs of a cost-conscious and disciplined consumer, having learned lessons from past expansion or boom and bust cycles. It's no wonder this has become the longest expansion cycle in history.
“What we are seeing now is that growth in consumer spending is settling into a more sustainable pace after the frenzied, but unsustainable, pace seen in the second quarter,” contended chief economist Richard Moody of Regions Financial.
I suggested last week that my favorite economic report was due out this past trading week by way of the Federal Reserve Bank of New York's Household Debt & Credit Report. The consumer has a job, rising wages, low inflation and remains with a strong balance sheet... at least that's what we've said for several years now. But each quarter we desire to see the trend of the consumer's debt burden and trending debt and delinquency rates. That's what this report from the New York Fed offers. We don't necessarily need this report, but for the sake of its trending categories of debt and delinquency rates. Outside of this report, we can simply look at household obligations as a percentage of disposable income. This blends into strength or weakness in consumer spending and retail sales data. As you can see from the chart below, financial obligations as a share of disposable income is only 15 percent. Besides a blip in 2012, this is the lowest reading since at least the late 1970s-early 80's.

In the New York Fed's report, debt increased $92 billion which is a 0.7% increase. The $13.95 trillion in debt is above the 2008 peak of $12.68 trillion. That’s only a 0.96% compound annual growth rate. The fact that housing debt is down from $9.99 trillion to $9.83 trillion in an 11 year period shows how artificial the housing bubble was and how growth has been more stable this cycle. As you can see from the chart below, mortgage debt is only 67.6% of total debt. It peaked at almost 74% last cycle. Credit card debt also isn’t an issue as it’s at $880 billion and it peaked at $870 billion in 2008. It took 10.75 years to grow about 1%.

The quarterly report doesn't tell us anything new from the last quarterly report. Most debt categories remain stable or down trending, shy of auto loan debt. Fortunately, this category that is comprised of auto loan debt in the $10s of thousands is not akin to the mortgage crisis in 2008 which found mortgage debt obligations per loan in the $100s of thousands.
Any which way you slice it, the consumer is in great shape. I hesitate to say great, but it's the truth. Yes, this can be disrupted, but the excesses from past economic cycles don't exist in the present and as such should the consumer be found waning it would likely only be to a modest degree and for a brief period. Balance sheet is just too strong.
With all this consumer talk in focus and the consumer in pretty good shape along many metrics we review, unfortunately, one such metric has faltered for the last few months.
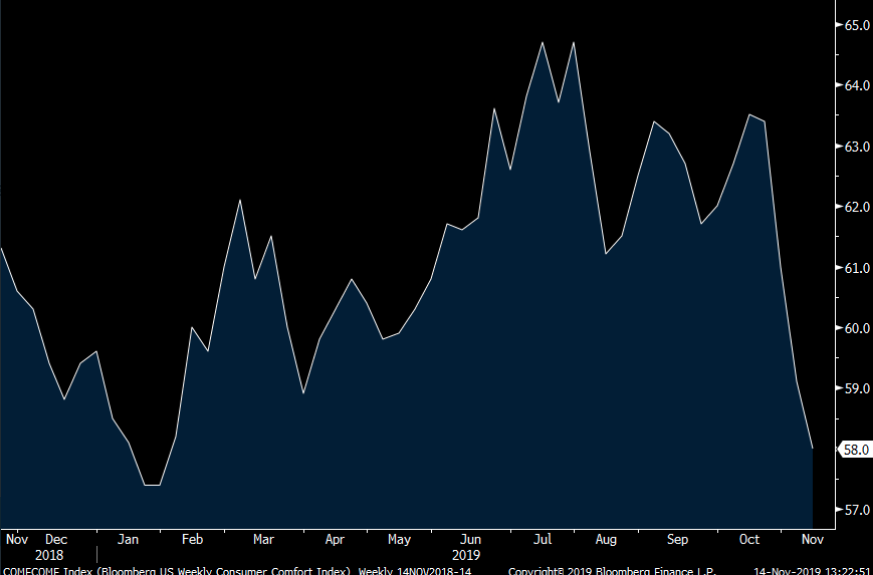
Recently, the Bloomberg Consumer Comfort index has collapsed, which is a bad sign for the holiday shopping season. The chart above shows the steepest 3-week decline since 2008. I'm really not sure what to make of it, even though we have seen it this low back in January of this year and coming out of the technical bear market of 2018. The Consumer Comfort Index seems to be out of step with both Consumer Confidence and the University of Michigan's Consumer Sentiment survey. There may be some effects from the UAW/GM strike that are playing a role in the index reading, as it does seem to fit the time frame almost perfectly. I will be keeping an eye on this one going forward.
For the week to come, investors, economists, and analysts will be eyeing housing data and Leading Economic Indicators. It's another light economic data release week, but we're going to need to see the housing sector continue to outperform if GDP is going to get off of these low levels that are being forecasted by regional Fed's and big money center banks.
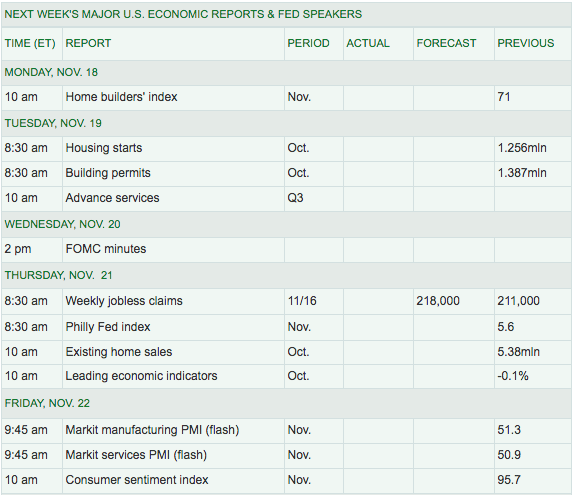
Housing starts and Building permits will be a key economic data point for the week. Both were relatively strong in September as mortgage rates remain staunchly lower than at the same period a year ago. Given the rise in jobless claims this past week, economists will desire to see the typical snapback lower when the data is released on Thursday, alongside LEI and Existing Home Sales... at least we do not forget about the Philly Fed Index. Rounding out the weak are those pesky PMI data points from Markit, which are presently hovering just about the dividing line between contraction and expansion territories.
Given the produced data over the last week, most regional Fed's have lowered their Q4 GDP forecasts.
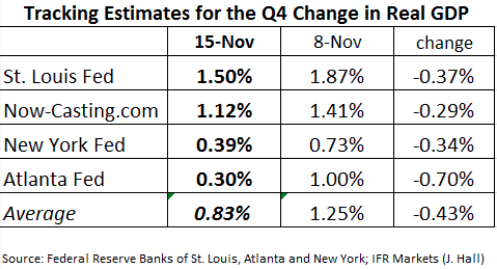
Here are what some of the big money center banks and financial institutions are now forecasting for Q4 GDP:
- JPMORGAN: "We are lowering our forecast for 4Q real GDP growth from 1.75% to 1.25% saar following the October retail sales report."
- From Merrill Lynch: We continue to track 1.9% for 3Q GDP tracking. 4Q tracking is at 1.5%. [Nov 15 estimate]
Despite the lowered Q4 GDP forecasts, it appears investors are a bit more optimistic on the global economy, given the amount of central bank easing that has taken shape through 2019. Global growth expectations jumped 43ppt, the highest MoM change on record, as recession concerns vanish, in this month’s Bank of America Merrill Lynch Fund Manager Survey

I am still seeing a strong but modestly weakened U.S. economy. Whether or not the economy will increase its pace of growth in 2020 is partly going to be a function of combined consumer and business confidence and spending. Naturally, these force factors can and will likely come together positively in the event of a phase 1 trade deal that dispenses with the unknowns surrounding future tariff impositions.
I don't see a recession on the horizon without an exogenous shock to the economy, which is above my pay-grade and forecasting capabilities. All things considered equal, the slow growth pace of the economy that has become the "calling card" of this economic expansion cycle is likely to continue with bouts of above-trend and trend-growth periods. Here is what Goldman Sachs had to say about what will likely drive economic acceleration in 2020:
- The recent Fed cuts will boost U.S. GDP in coming quarters as the effects of easier financial conditions flow through the economy
- Our economists believe that tariffs have peaked and that the drag on US GDP attributable to the US-China trade war is now abating. Their base case is that tariff levels on imports from China remain flat in 2020.
- The bottoming of the inventory cycle will also contribute to better economic growth next year.
- The resolution of several idiosyncratic events that have weighed on US economic growth in 2019 should provide an additional economic boost. For example, the GDP drag in structures investment attributable to the decline in oil prices should subside as oil prices stabilize. In addition, the GM strike resolution should lead to a rebound in auto output and boost to payroll growth as workers return to their position
Fund Flows Still Improving
It was another positive weekly fund flow report delivered from Lipper and if you're an equity investor. ETFs had net-positive flows of $4.3 billion thanks to the equity ETF asset group (+$5.6 billion). The largest individual net inflows among equity ETFs belonged to iShares Core MSCI EAFE ETF (IEFA, +$1.6 billion) and Invesco QQQ Trust 1 (QQQ, +$1.3 billion). Muni bond ETFs also contributed to the total net inflows as they took $176 million in net new money for the week for the group’s sixth consecutive weekly increase. Taxable bond ETFs saw $1.5 billion leave last week as iShares 20+ Years Treasury Bond ETF (TLT, -$656 million) and iShares iBoxx $ High Yield Corporate Bond ETF (HYG, -$461 million) suffered the largest single net outflows.
Money market funds (+$18.4 billion) took in net new money for the fourth straight week. All of the money market fund peer groups recorded net inflows for the week, with the Institutional U.S. Treasury Money Market Funds (+$6.7 billion) and Institutional U.S. Government Money Market Funds (+$5.2 billion) peer groups leading the way.
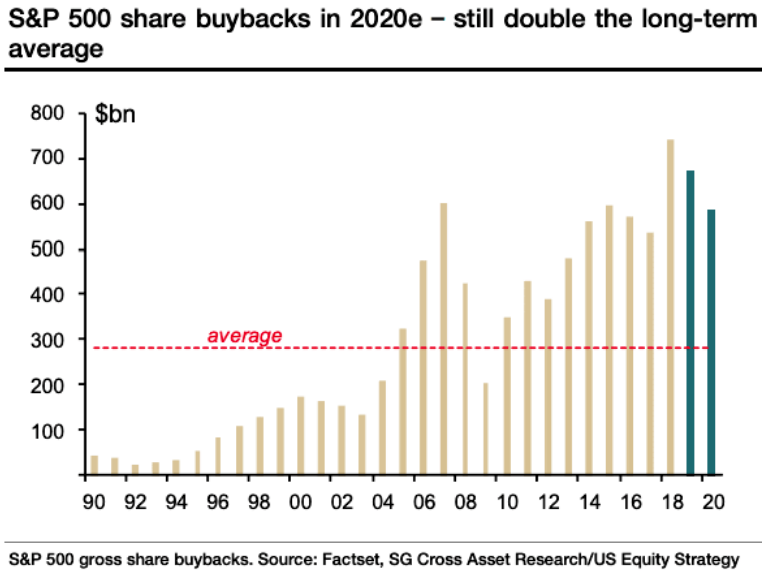
The following BofAML fund flow chart suggests we should all be grateful for corporate buybacks, as they have been mainly responsible for sustaining the bull market over several years.

In 2019, we've witnessed record bond inflows and record equity outflows. And it is likely that buybacks may not live up to the record-setting year in 2018 and decline further into 2020, according to SocGen:
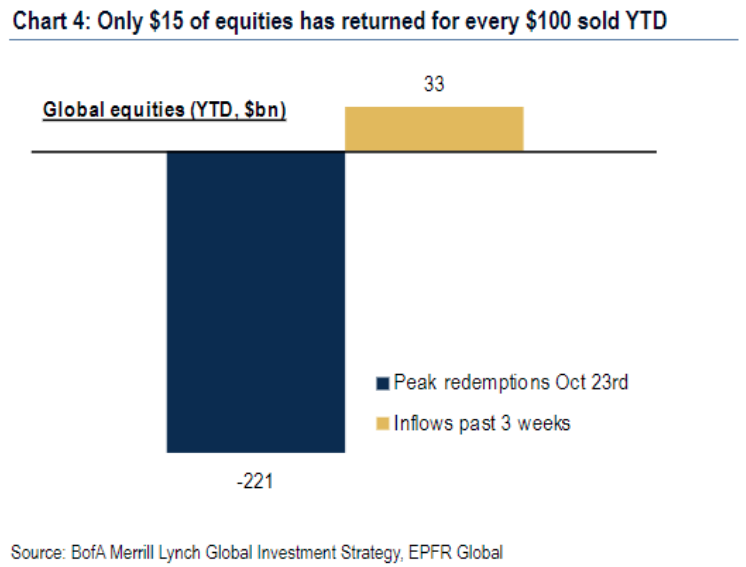
Moreover, in 2019, we've come past the point of peak redemptions it seems and as such we've seen Lipper report 3 consecutive weeks of equity ETF inflows. The positives are mounting for a melt-up rally into year-end. Such a melt-up would be best met with a near-term pause and digestion of the last 60 days' worth of gains. There's still some gaps to fill in the chart of the S&P 500 and those gaps tend to get filled sooner than later once all-time record levels are found.
Equity fund flows have improved in the last several weeks and it is showing up in the right, risk-on places of the market. Defensive sectors have taken a backseat to offensive sectors. If you were looking for one more bullish signal from the data, fund flows are providing you with that bullish signal as recently.
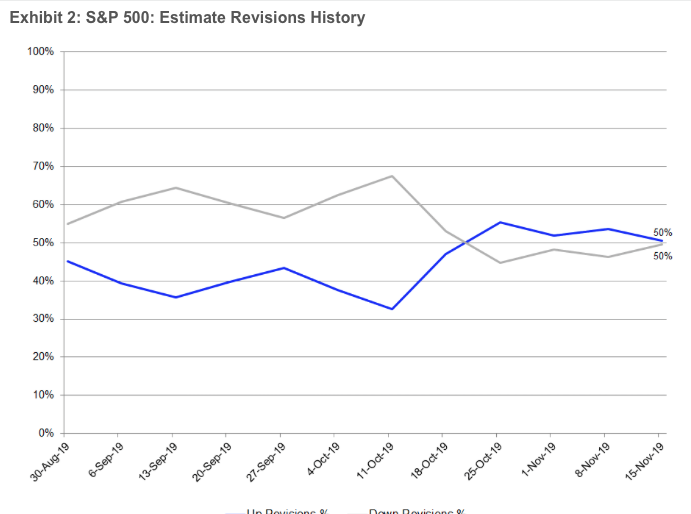
Earnings Outlook
As mentioned for each passing week during earnings season, I've anticipated positive revisions from both FactSet and Refinitiv with regards to Q3 EPS forecasts. Recall that at the onset of earnings season, FactSet was forecasting a decline of S&P 500 EPS on a YoY basis of -4.7 percent. If the beat rate holds constant through earnings season, the actual EPS decline will only be -.5% YoY. Unfortunately, the beat rate has not held constant as you will see below. So let’s take a look at the latest EPS outlook for the Q3 earnings cycle from FactSet.
- Earnings Scorecard: For Q3 2019, 92% of the companies in the S&P 500 have reported actual results for Q3 2019. In terms of earnings, the percentage of companies reporting actual EPS above estimates (75%) is above the five-year average. In aggregate, companies are reporting earnings that are 3.9% above the estimates, which is below the five-year average.
- Earnings Growth: For Q3 2019, the blended earnings decline for the S&P 500 is -2.3%. This is an improvement from the prior forecast of -2.4%.
- The blended revenue growth rate for the third quarter is 3.1%, which is lower than the revenue growth rate of 3.2% last week.
Insight/2019/11.2019/11.15.2019_EI/S&P%20500%20Earnings%20Growth.png?width=920&name=S&P%20500%20Earnings%20Growth.png)
Looking ahead, analysts see a decline in earnings in the fourth quarter followed by 5% to 6% earnings growth for Q1 2020 and Q2 2020. The forward 12-month P/E ratio is 17.5, which is above the five-year average and above the 10-year average. During the upcoming week, 15 S&P 500 companies (including one Dow 30 component) are scheduled to report results for the third quarter. The following graphic identifies some of the key earnings reports due out this coming week.
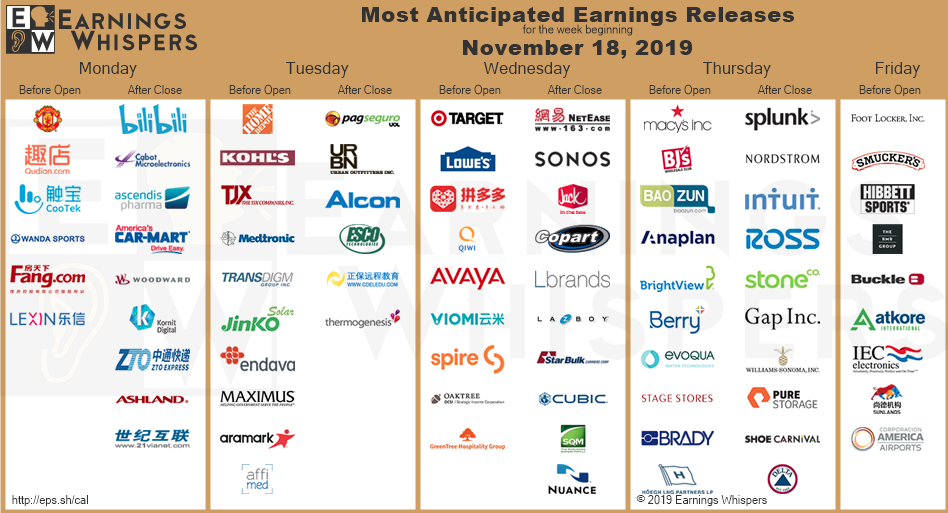
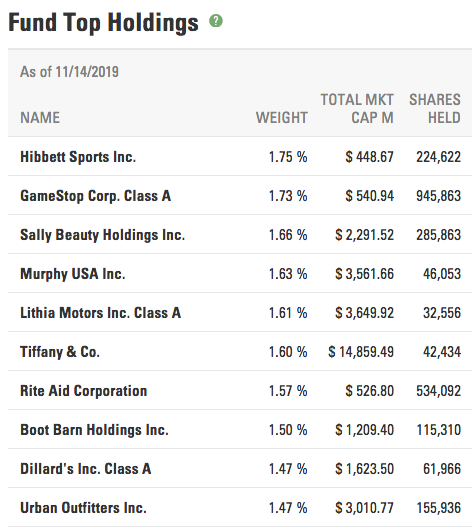
Retail reporting season is in full swing, with Target (TGT), Kohl's (KSS), Home Depot (HD), TJ Maxx (TJX), Lowe's (LOW) and Macy's (M) all reporting this week and just to name a few. The retail sector has seen a good deal of share price appreciation as of late and as shown in the sector ETF (XRT) chart below:
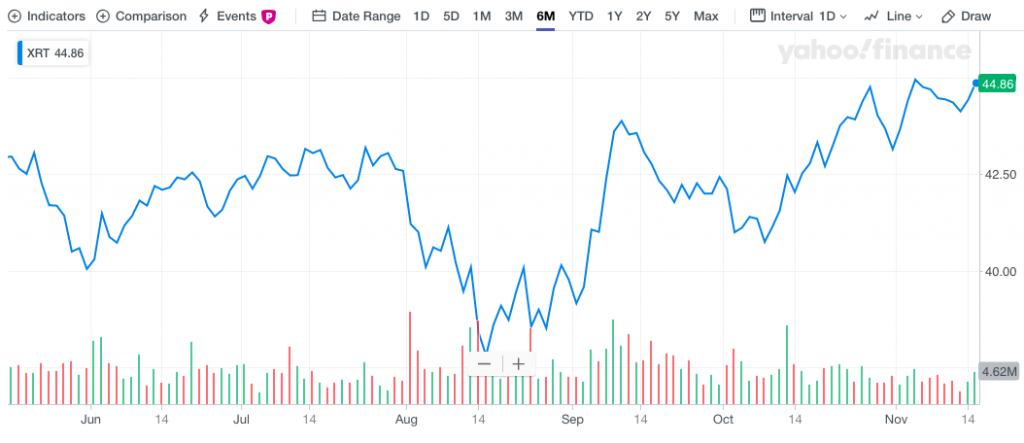
Here are the top holdings in the ETF... Did I mention I don't like it 2 bits?
For now, let's roll on and take a look at the latest Q3 2019 earnings forecast from Refinitiv.
Aggregate Estimates and Revisions
- Third-quarter earnings are expected to decrease -0.4% from 18Q3. The revision is up from last week's forecast of -.5% for 19Q3 Excluding the energy sector, the earnings growth estimate is 2.2%.
- Of the 461 companies in the S&P 500 that have reported earnings to date for 19Q3, 74.6% have reported earnings above analyst expectations. This compares to a long-term average of 65% and prior four-quarter average of 74%.
- 19Q3 revenue is expected to increase by 3.8% from 18Q3. Excluding the energy sector, the growth estimate is 5.2%.
Earnings aren't great, there not even good when compared to 2018, but that's the point. The bar was simply set to high, the probability of growing earnings in 2018 was always going to be limited or found for low probability given the outsized growth brought about by the Tax Reform Act of 2018. Coupled with the commencing of a trade war late in 2018 that has persisted through much of 2019 and its quite remarkable that we haven't seen a greater earnings decline. And now, oh yes and now, the bar is being set low in 2019 for which earnings can easily jump over in 2020. The trade war is presently on a de-escalation path to boot, which may bring about greater business investment in 2020. The price of crude is stable and may moderate-higher, which will prove a benefit to the energy sector profit profile. Last, but certainly not least, any Brexit resolution and global economic growth sentiment improvement might bring about a weakening U.S. Dollar.
Investor Takeaways
The S&P 500 is up 6 straight weeks. The market has advanced as much as the long-term historical average annual return, about 4.5 percent. This might might suggest a couple of things, according to Lance Roberts of Clarity Capital.
- The market has already priced in a bulk of the benefit from the additional liquidity injection.
- The market has advanced too rapidly, like it or not.
So what can, should or might you do as an investor given the rapid rally. Keep in mind, long-term investors are welcome to align with a passive strategy given the long-term bullish breadth/internals outlined within. Active portfolio managers might choose a different path, however.
This record-long bull market will be most noted for the "fear" that has been pervasive throughout this run. It will also be noted for the massive number of pundits who have argued against it for years.
In conclusion, with all of the information outlined, what are you doing to protect your portfolio at this stage of the bull market and in the final months of the year? Some options to consider are as follows: (from Clarity Capital)
- Do Nothing – if the markets correct, the portfolio loses some of its gains and will just have to wait for the portfolio to recover.
- Take Profits – take profits, raise cash, and reduce equity exposure in advance of a correction. Such actions mitigate the damage of the decline, but positions have to be repurchased, or new ones added, to resize the portfolio in the future.
- Hedge – adding a position to the portfolio that is the “inverse”of the market. (The position goes up in value as the market declines.) This action allows one to keep existing positions intact, and by “shorting against the portfolio” allows one to effectively reduce equity risk (and related capital destruction) during a market correction.
Hedging against a probable near-term market-topping formation isn't a bad idea, but rather an exercise that demands a cautious and thoughtful approach in and of itself. How does one hedge? In my opinion, hedging with VIX derivatives is an absolute nightmare and a poor discipline despite what you might hear and see in the media. It demands precision for most every aspect of the hedge including choice of strike, duration, and premium just to name a few. In my opinion, the most opportunistic method to hedge risk is to add a short S&P 500 or SPY position to the portfolio. If you desire a little more alpha, the QQQ will get you there!


