
Top 3 Price Prediction Bitcoin, Ethereum, Ripple: Bitcoin Tumbles As Altcoins Present The Best Buy-The-Dip Opportunities
The market is a sea of red following Bitcoin’s recent slide to $18,000. Altcoins across the board dived in tandem with BTC, but on-chain metrics suggest that this is the best time to buy the dip and capitalize on their potential recovery.

Image Source: Pexels
Bitcoin network growth remains bearish
According to Santiment, Bitcoin’s DAA vs. Price Divergence has deviated from the mean for nearly two years. The network’s active address activity has also been bearish, mostly due to the consistent decline in the number of addresses joining the network and interacting on the blockchain. In other words, BTC address activity is failing to keep up with the month-over-month price increase since September.
(Click on image to enlarge)
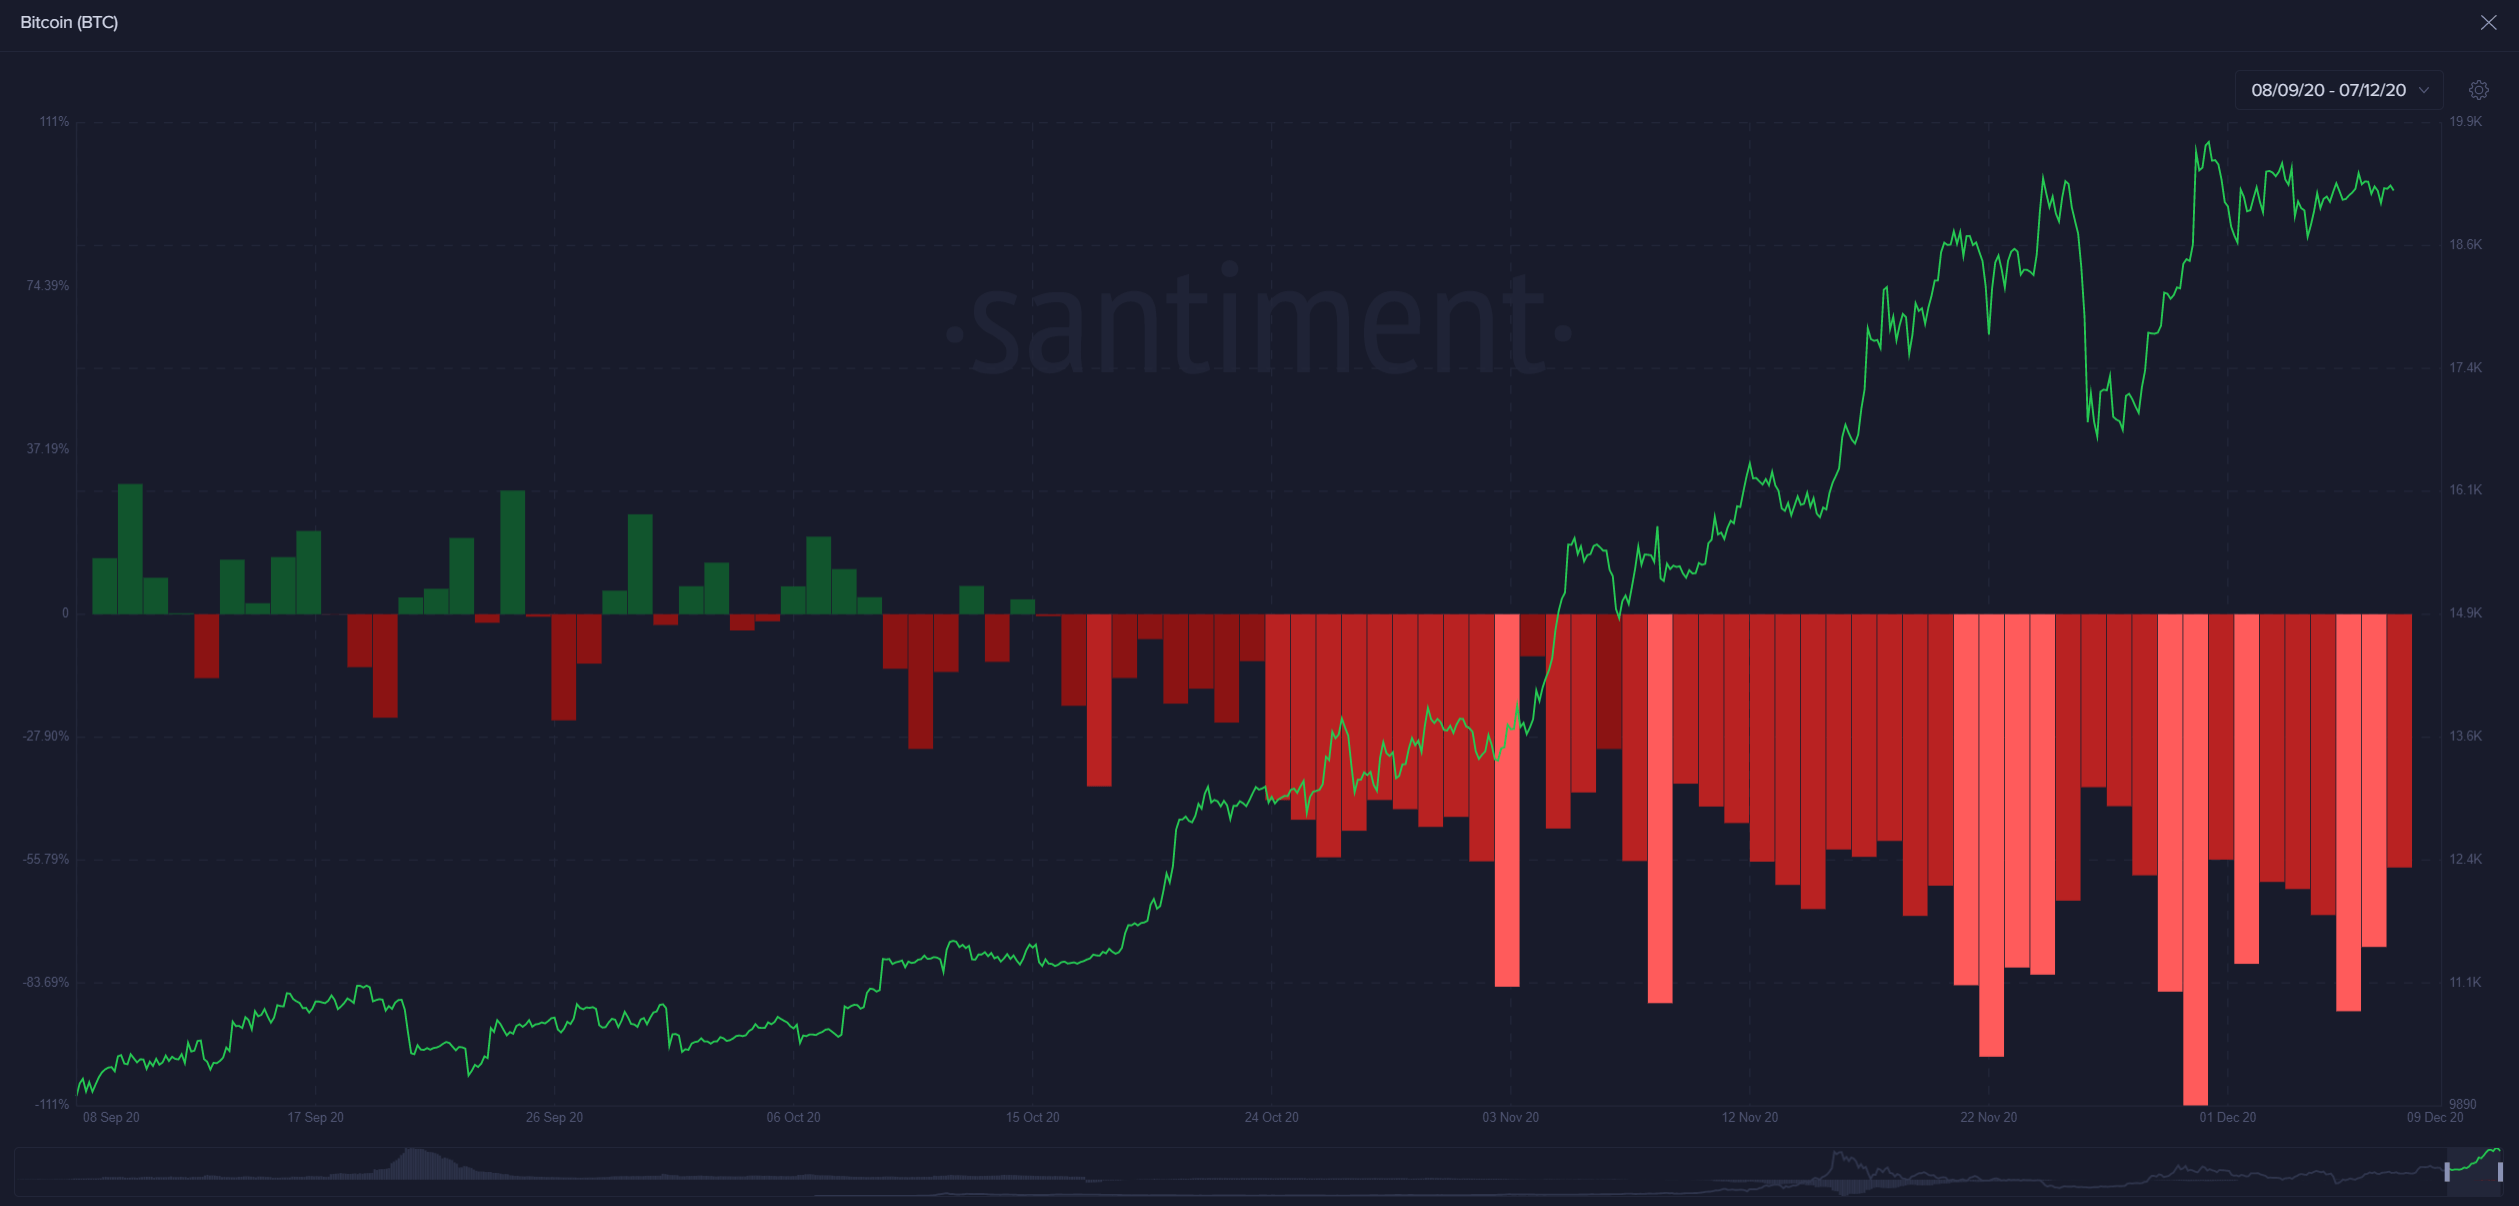
Bitcoin DAA vs. Price Divergence chart
Meanwhile, Bitcoin is on the verge of a retreat to $16,500 if the short-term 200 Simple Moving Average caves. Sell orders are likely to surge, creating enough volume to validate the bearish trend. On the upside, overhead pressure is mounting under $18,000, further dampening the hope for recovery.
(Click on image to enlarge)
%20(85)-637431035022237031.png)
BTC/USD 4-hour chart
For now, Bitcoin’s path of least resistance is downwards. However, a bullish outlook may start to form if the price closes the day above beneath the 200 SMA. Price action past $18,000 will call for more buyers to join the market as BTC scales the levels back to $19,000.
Ethereum investors await the most reliable entry point
The MVRV Opportunity/Danger Zones indicator from Santiment shows that investments in the last seven days have suffered greatly. On the other hand, investments with a 30-day moving average have remained relatively neutral.
Intriguingly, the network is still netting a long-term success record. For now, it is still shaky ground to go all-in on Ether. Still, investors are probably waiting for another leg down before they confidently pounce on the second-largest cryptocurrency.
(Click on image to enlarge)
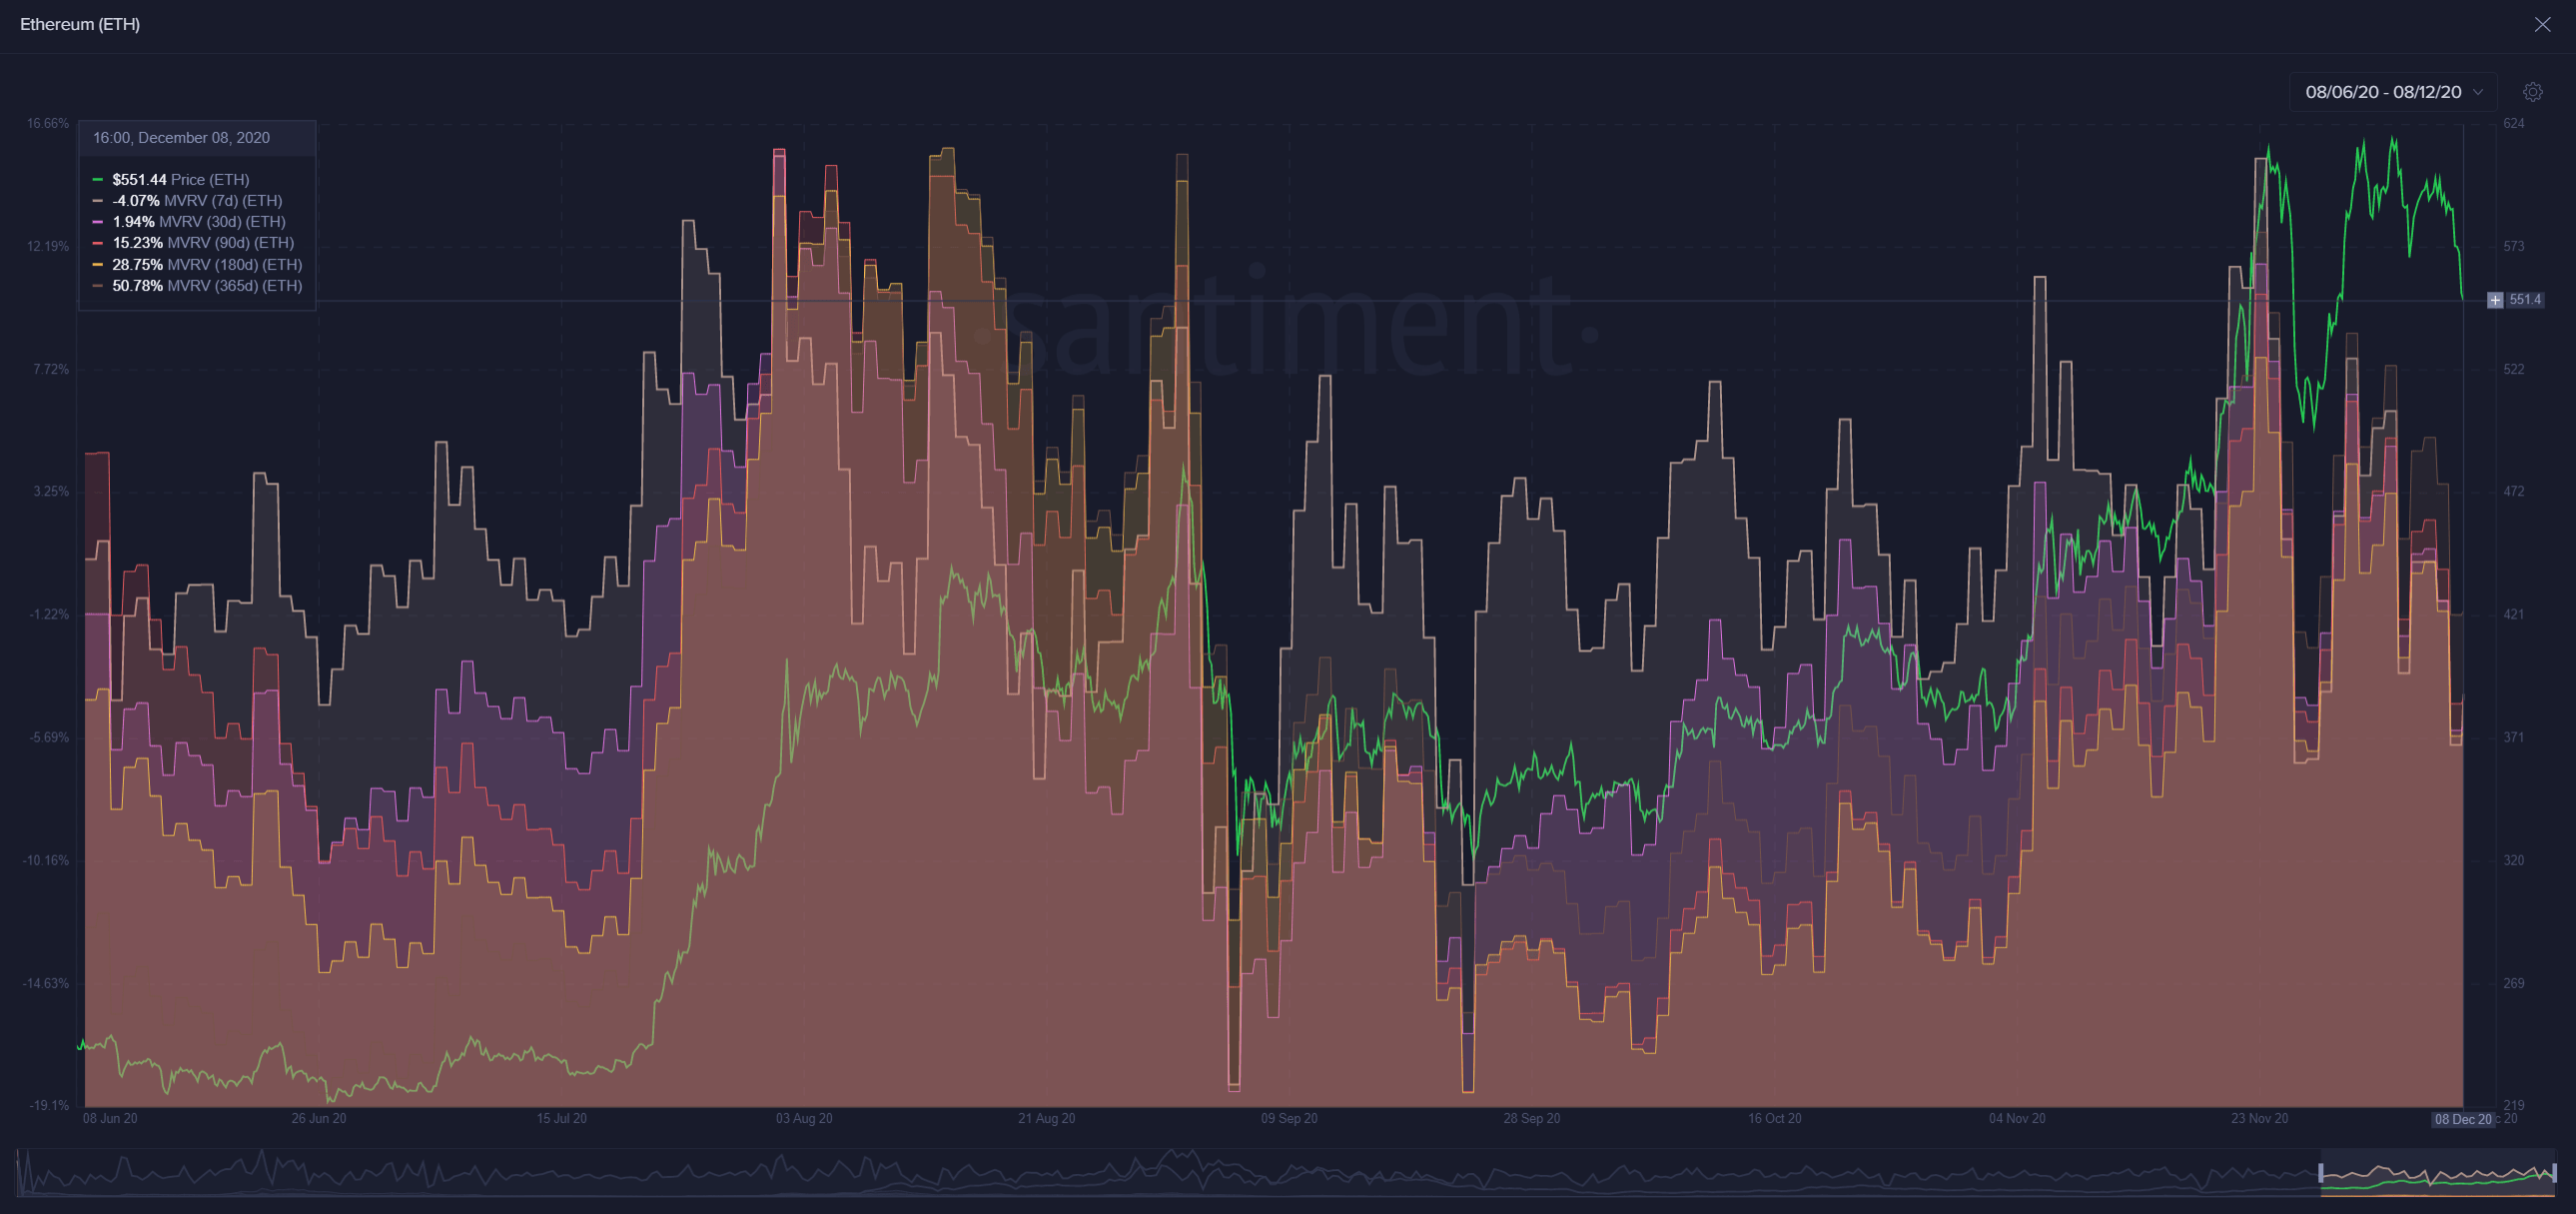
Ethereum MVRV Opportunity/Danger Zones chart
After Ether extended the bearish leg under the ascending triangle, support at $530 seems to have come in handy. The near-term buyer congestion at the 200 SMA was not touched. In the meantime, ETH has rebounded to $540.
The Relative Strength Index adds credence to the short-term bullish outlook by embracing recovery from the oversold region. A daily close above $540 would be a critical bullish signal, allowing buyers to focus on gains above $560 and $580, respectively.
(Click on image to enlarge)
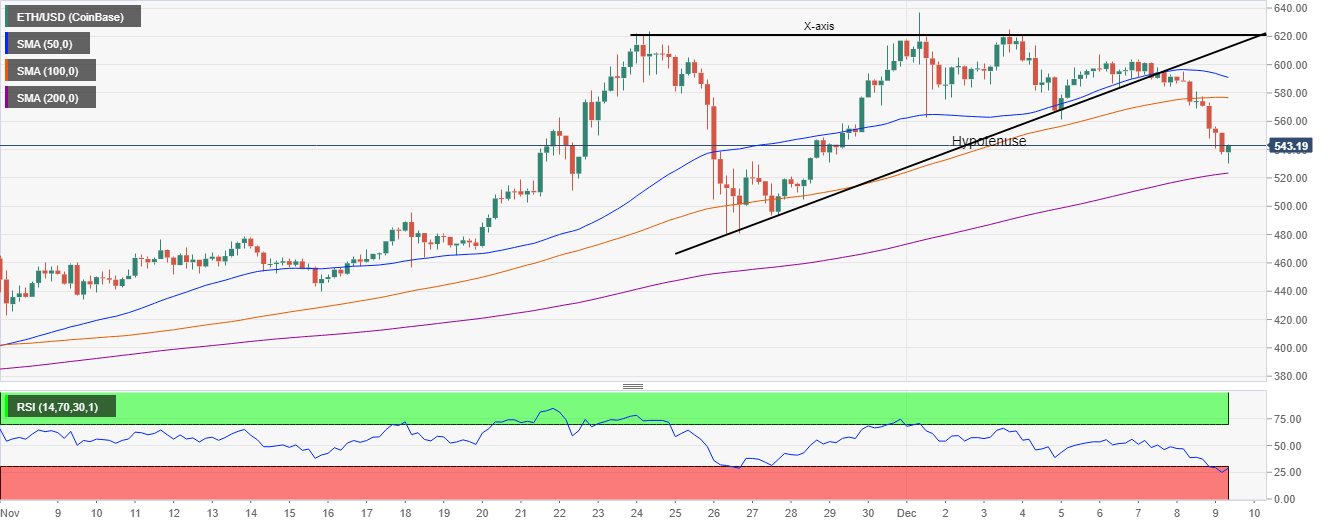
ETH/USD 4-hour chart
Ripple’s dumping continues as $0.4 beckons
The cross-border token’s breakdown seems unstoppable after the breakout under the symmetrical triangle. At the time of writing, XRP is seeking refuge above $0.5 while trading at $0.52. A daily close below $0.5 might confirm the impending drop to $0.4, marginally above the 200 SMA.
The triangle has presented a downward target of $0.33. Therefore, bulls have an uphill battle to shake off the bearish pressure and return XRP on the pathway to $1. The RSI doubles down on the intense bearish pressure as it buries itself more in-depth in the oversold area.
(Click on image to enlarge)
%20(25)-637431036736125377.png)
XRP/USD 4-hour chart
Ripple will get back to the uptrend if support at $0.5 remains intact. Trading above $0.55 might confirm the return of the bulls, thus encouraging recovery above $0.6.
Disclaimer: Information on these pages contains forward-looking statements that involve risks and uncertainties. Markets and instruments profiled on this page are for informational purposes only ...
more

