
Top 3 Price Prediction Bitcoin, Ethereum And XRP: Upward Momentum Hits Pause
Cryptocurrencies across the board rebounded strongly on Thursday, in a way reminding investors that we are still in a bull market. Some altcoins such as Chainlink (LINK) and Synthetix (SNX) rallied massively, posting gains above 20% in the last 24 hours. Bitcoin, Ethereum and XRP also resumed their uptrends but slowed down before making huge strides above critical levels.
As reported, the rebound saw the total market capitalization grow from Thursday’s $320 billion to the current $337 billion. A minor change in the volume traded was recorded from $92 billion to $94 billion according to the data by CoinMarketCap. The market is mainly in green, while some cryptocurrencies are showing signs of a further upward correction.
Cryptocurrency market cap
(Click on image to enlarge)
-637366132089899813.jpg)
Bitcoin braces for a challenging ride ahead
The flagship cryptocurrency confirmed the bull flag pattern discussed on Thursday, topping $10,800. However, the impressive rebound lost steam on failing to disperse the seller congestion at that level. A retreat has been underway, with BTC revisiting levels beneath $10,700. The exhaustion the bulls are facing is highlighted by the retreating Relative Strength Index (RSI). Consolidation would most likely come into the picture before Bitcoin embarks on the journey of breaking barriers to $12,000.
The first key resistance is highlighted at $10,800 (an area that functioned as support between September 16 and September 20). Attempts to resume the uptrend to $12,000 must be ready to tackle resistances two and three at $11,000 and $11,200, respectively.
BTC/USD 4-hour chart
(Click on image to enlarge)
%20(37)-637366133085113354.png)
The retracement will likely retest initial support at $10,600. A reversal to the primary support between $10,000 and $10,200 may find refuge at the 100 Simple Moving Average and the 50 SMA in the 4-hour range.
IntoTheBlock’s IOMAP model exposes that the bellwether cryptocurrency’s path to $12,000 will be challenging. For instance, the initial resistance between $10,698 and $11,007 is strong enough to delay the uptrend. About 936,000 addresses previously bought 516,660 BTC in this range. A spike above this zone would probably not make it past the most significant resistance at $11,316 - $11,644. Here, 1.13 million addresses previously purchased 667,890 BTC.
Bitcoin IOMAP chart
(Click on image to enlarge)
-637366133605498805.png)
On the flip side, Bitcoin is sitting above an area with an immense concentration of buyers. Around 1.42 million addresses purchased 1.15 million BTC in the range between $10,369 and $10,516. The buying pressure in this area can reduce the impact of a reversal from the current price level.
Intriguingly, some whales have been on a buying spree according to Santiment’s holder distribution metric. The recent slump in the market offered investors opportunities to “Buy the Dip” as discussed before. For instance, wallets holding between 10,000 and 100,000 BTC increased from 104 on September 18 to 110 on September 25. The rise in buying pressure must have given BTC the push to $10,800. However, these whales could start selling, making it difficult for Bitcoin to continue with the uptrend.
Bitcoin holder distribution chart
(Click on image to enlarge)
%20[08.25.43,%2025%20Sep,%202020]-637366134113254609.png)
Ethereum abandons bullish case to $360
The second-largest cryptocurrency eyed $360 before the breakout on Thursday. Although a rebound occurred, Ether did not hit the expected highs at $360. Instead, it hit a barrier at $355 due to the increase in selling pressure. The 50 SMA at $360 has proved to be a hard nut to crack, hence the retreat. At the time of writing, ETH/USD is doddering at $343 amid a building bearish momentum. The RSI emphasizes the momentum as it dips beneath the midline.
ETH/USD 4-hour chart
(Click on image to enlarge)
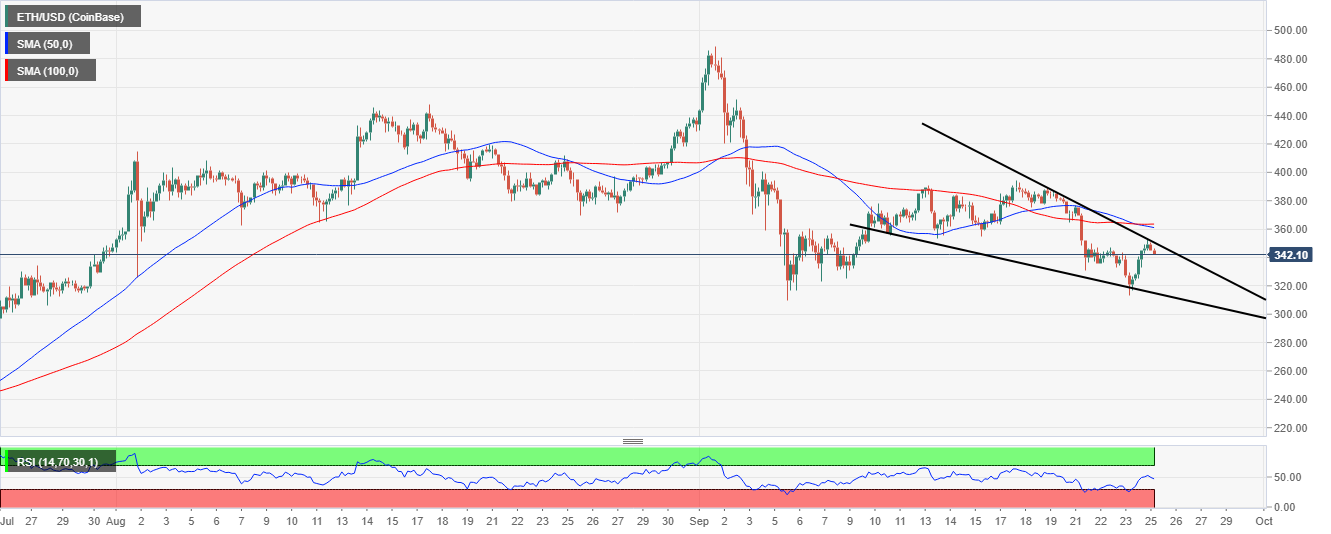
The descending wedge pattern in the 4-hour range suggests that Ethereum will eventually regain the uptrend. However, IntoTheBlock’s IOMAP shows that recovery could delay much longer due to the resistance between $354 and $365. Here, slightly over 414,000 addresses previously bought 10.34 million Ether. It is important to note that if this crucial resistance is turned into support, ETH could quickly rush to $380.
Ethereum IOMAP chart
(Click on image to enlarge)
-637366135148925442.png)
The lack of vital support areas could spell doom for Ethereum in the near term on the downside. Subtle support is highlighted between $334 and $343, where nearly 688,000 addresses bought 2.96 million ETH. Declines could revisit the recent support at $310 if the range between $334 and $343 caves.
XRP sticks to a lower high pattern
Despite rebounding from the support at $0.22, XRP is still far from establishing a strong uptrend. A glance at the 4-hour chart shows the crypto trading a higher low pattern, unable to break the descending trendline resistance. Besides, the RSI has bounced off the midline and its retreat would signal a rise in selling activities. On the upside, XRP will face a tough challenge at $0.24, a resistance highlighted by the 50 SMA.
XRP/USD 4-hour chart
(Click on image to enlarge)
%20(68)-637366136796534467.png)
According to Santiment’s holder distribution metric, a downtrend in the number of whales holding between one million and ten million XRP could be absorbing the buying pressure in the market. These whales have declined from 1,348 on September 22 to 1,334 on September 25. If the large volume holders' selling pressure continues to increase, we can expect XRP to explore the support at $0.22 or $0.20 in the near term.
XRP holder distribution chart
(Click on image to enlarge)
%20[09.53.11,%2025%20Sep,%202020]-637366136092802740.png)
The cryptocurrency market is likely to take a breather after a strong rebound on Thursday. Bitcoin could enter into consolidation, resting on the support highlighted between $10,369 and $10,516. The support will give the bulls ample time to rejuvenate before launching another attack on critical levels at $10,800, $11,000 and $11,200. Ethereum, on the other side, is not done with the downside and support at $310 could be refreshed. On the other hand, XRP faces an uphill task because if it does not break above the 50 SMA ($0.24), the chances are that prices will fall to refresh support at $0.22.
Disclaimer: Information on these pages contains forward-looking statements that involve risks and uncertainties. Markets and instruments profiled on this page are for informational purposes only ...
more

