
This Week's Futures Positions Of Non-Commercials; Commitment Of Traders
Following futures positions of non-commercials are as of July 23, 2019.
10-year note: Currently net short 380.2k, up 32.9k.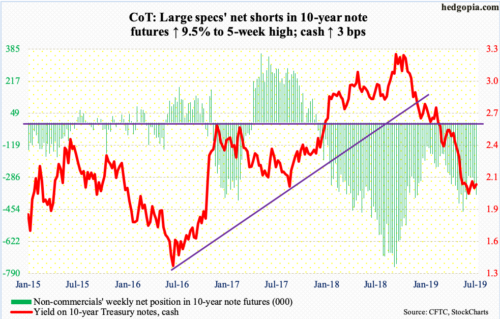
Next Wednesday, the Fed will have eased, probably by 25 basis points to a range of 200 to 225 basis points. This will be the first cut in nearly 11 years. Futures markets expect another 25-basis-point cut in September, and maybe another in December. If the Fed yields to market demands, repercussions will be felt on at least two fronts.
Post-financial crisis, the Fed aggressively expanded its balance sheet. System Open Market Account (SOMA) holdings went from $500 billion in December 2008 to a peak of $4.24 trillion in April 2017. The bank began to run these assets down in October that year. This Wednesday, they were $3.59 trillion. The ongoing balance-sheet normalization program is slated to end this September. It will be difficult for the Fed to continue to tighten using an unconventional tool while it is easing conventionally. This will have implications for a whole host of assets, including equities and bonds.
Also, post-financial crisis, the Fed began paying interest – currently 2.35 percent – on commercial banks’ excess reserves, which rose along with the central bank’s balance sheet. Pre-crisis, excess reserves were negligible, but by September 2014 had grown to $2.72 trillion. As of Wednesday last week, they stood at $1.38 trillion. This is still massive. Last year, the Fed paid banks $38.5 billion in interest on reserves, which increasingly will be at risk the lower the fed funds rate goes as IOER tracks the policy rate.
30-year bond: Currently net short 41.6k, up 19.9k.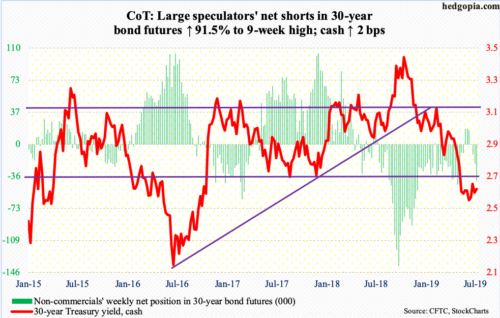
Major economic releases next week are as follows.
On Tuesday, personal income (June) and the S&P Case-Shiller home price index (May) come out.
Core PCE – the Fed’s favorite measure of consumer inflation – rose 1.6 percent in the 12 months to May. The Fed has a two percent objective. Since May 2012, only once has core PCE grown with a two handle, which was July last year.
Nationally, April home prices rose 3.5 percent year-over-year. Price appreciation has decelerated since peaking at 6.5 percent in March last year.
The employment cost index (2Q19) is scheduled for Wednesday. In the 12 months to 1Q19, total comp rose at an annual rate of 2.81 percent – a five-quarter low.
Thursday brings the ISM manufacturing index (July). Manufacturing activity in June dropped four-tenths of a point month-over-month to 51.7. The cycle high 60.8 was reached last August.
Payrolls (July), the University of Michigan’s consumer sentiment index (July, final) and revised estimates for durable goods (June) come out Friday.
The economy added 224,000 non-farm jobs in June, for a monthly average in the first half this year of 172,000. In 2018, an average 223,000 was added every month.
July’s preliminary reading showed consumer sentiment inched up two-tenths of a point m/m to 98.4.
Preliminarily, June orders for non-defense capital goods ex-aircraft – proxy for business capex plans – rose two percent y/y to a seasonally adjusted annual rate of $70.1 billion – a new high.
Crude oil: Currently net long 547k, down 38.2k.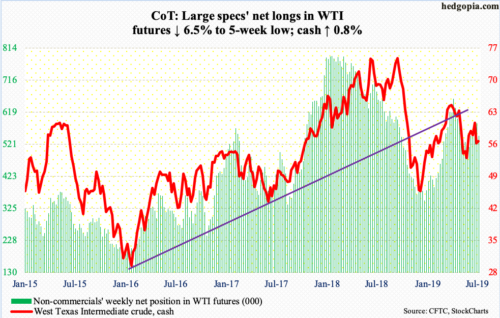
Having lost the 50- and 200-day moving averages last week, the cash ($56.20/barrel) tried to retake the former several times this week, but to no avail. For now, the crude remains trapped between two trend lines – resistance from October last year around $60 and support from December last year around $53. If the weekly prevails, it is likely a test of the support occurs first.
In the week to July 19, US production fell 700,000 barrels per day to 11.3 million bpd, down one mbpd over two weeks, thanks to Hurricane Barry. Refinery utilization fell 1.3 percentage points to 93.1 percent. Gasoline stocks fell 226,000 barrels to 232.5 million barrels, while distillates rose 613,000 barrels to 136.8 million barrels. Crude stocks, however, declined 10.8 million barrels to 445 million barrels – a 17-week low. Crude imports rose 196,000 bpd to seven mbpd.
E-mini S&P 500: Currently net long 54.4k, up 15.9k.
The cash (3025.86) Wednesday rose to a new intraday high of 3019.59, quickly surpassed by Friday’s 3027.98, but this was not enough to attract flows. In the week to Wednesday, SPY (SPDR S&P 500 ETF) lost $750 million. In fact, money came out of the ETF in all five sessions, for a loss of $5.4 billion, while VOO (Vanguard S&P 500 ETF) and IVV (iShares core S&P 500 ETF) gained a combined $297 million (courtesy of ETF.com). In the same week, US-based equity funds lost $8.4 billion (courtesy of Lipper). Money-market assets continue to grow, up $22.3 billion to $3.28 trillion (courtesy of ICI). This is the highest total since January 2010. In the meantime, both FINRA margin debt and Investors Intelligence bulls have firmed up in recent months, but fail to keep pace with equity indices that keep making new highs.
Bulls particularly look at the buildup in money-market assets as dry powder, even as bears view it as negative because it shows the rally’s inability to lure in parked funds. The truth probably lies somewhere in between. At some point, this money – at least a decent portion – will move into equities, but likely only after a decent correction takes place.
The weekly remains grossly overbought. Shorter-term averages on the S&P 500 are flattening out. This could be a precursor to an imminent rollover. Next week’s trading is crucial.
Euro: Currently net short 39k, up 7.7k.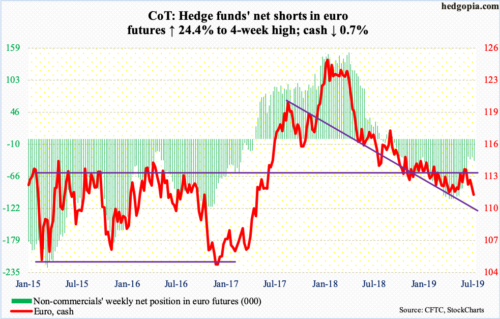
The ECB said Thursday it expects its key interest rates to remain at their present or lower levels at least through the first half of 2020. It said it was examining options if additional measures to stimulate the eurozone economy were needed. This is as good a wink and a nod as any that a rate cut – and possibly QE – is around the corner. Traders were not sure how to react. The cash ($111.36) Thursday ranged between $111.88 and $111.01 to close up $0.06 to $111.47; bulls defended $111 but at the same time were denied just short of $112.
When things settle, the daily has room to push higher, provided $111 does not give way. Dynamics chance should a breach occur. Friday, the euro fell to $110.77 intraday, but bids showed up to retake $111.
Gold: Currently net long 251.3k, up 5.7k.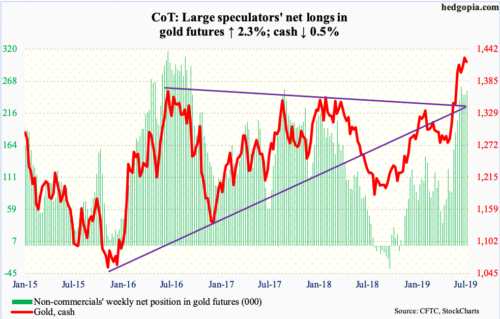
Flows continue not to be a problem. In the week to Wednesday, GLD (SPDR gold ETF) pulled in $869 million. In the prior nine, $3 billion came in. IAU (iShares gold trust) in the same week gained $239 million (courtesy of ETF.com).
Here is the thing. The cash ($1,419.30/ounce) has just been marking time. Five weeks ago, gold broke out of $1,350s-1,360s, before going sideways. Gold bugs hope the consolidation leads to another leg higher. Nonetheless, tons of money have already moved in, expecting exactly that outcome. Non-commercials’ net longs are near three-year highs.
The weekly is in overbought territory. Ideally, the metal drops to retest the aforementioned breakout – see if the breakout was genuine. At $1,365.27, the 50-day, which is sharply rising, lies around there as well.
Nasdaq 100 index (mini): Currently net long 23.3k, down 2.1k.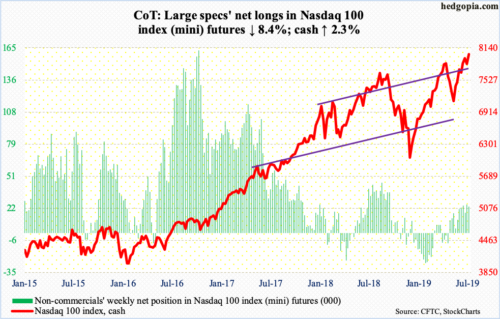
Yet another week and yet another record high, with the cash (8016.95) rallying to 8027.18 on Friday, surpassing Wednesday’s high. Regardless, in the week ended Wednesday, QQQ (Invesco QQQ trust) bled $1.3 billion (courtesy of ETF.com).
Until bears retake shorter-term averages, which bulls have been defending, the momentum ball remains with the latter. The 20-day was tested last week – successfully – and the 10-day several times this week.
Russell 2000 mini-index: Currently net short 87k, down 1.7k.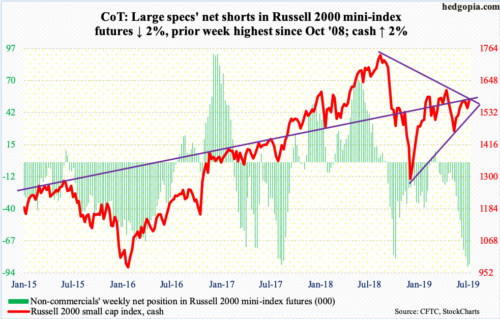
Small-cap bulls’ hopes were rekindled Wednesday when they seemingly out of nowhere put together a 1.6-percent rally, but only to get rejected at trend-line resistance from last August’s record high. The intraday high of 1581.63 in that session also fell short of crucial resistance just north of 1600. This occurred again on Friday. Until this level is recaptured, traders seem to have adopted the ‘sell the rip’ mantra.
That said, bears need to be able to push the cash (1578.97) below 1510 for added momentum. This is also where a trend line from last December’s lows rests.
US Dollar Index: Currently net long 29.1k, up 1.8k.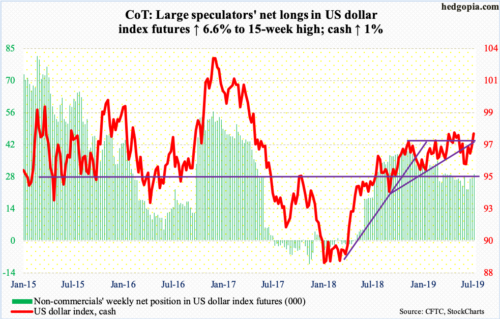
Having defended the 200-day last week, the cash (97.75) rallied past the 50-day this week. The daily is extended but can remain so near term as long as the US dollar index remains above 97.50s. Bulls are now probably eyeing the May 23rd high of 98.26.
VIX: Currently net short 132.3k, down 9.5k.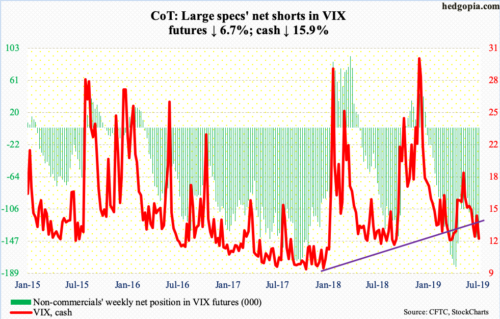
Volatility bulls’ attempt to rally past 14.50s was unsuccessful on Monday. By Thursday, the cash (12.16) was down to 11.69 intraday. Once again, 11-12 held. Wednesday’s low also just about tagged the daily lower Bollinger band.
For months now, VIX has remained suppressed, but it has done so at a higher plateau. The aforementioned resistance needs to crack for volatility to get any traction. The 50-day (14.96), which is now dropping, will soon get there.


