
This Week's CoT Report: What Hedge Funds, Noncommercials Are Buying
Following futures positions of non-commercials are as of April 26, 2022.
10-year note: Currently net short 117.8k, down 214.5k.
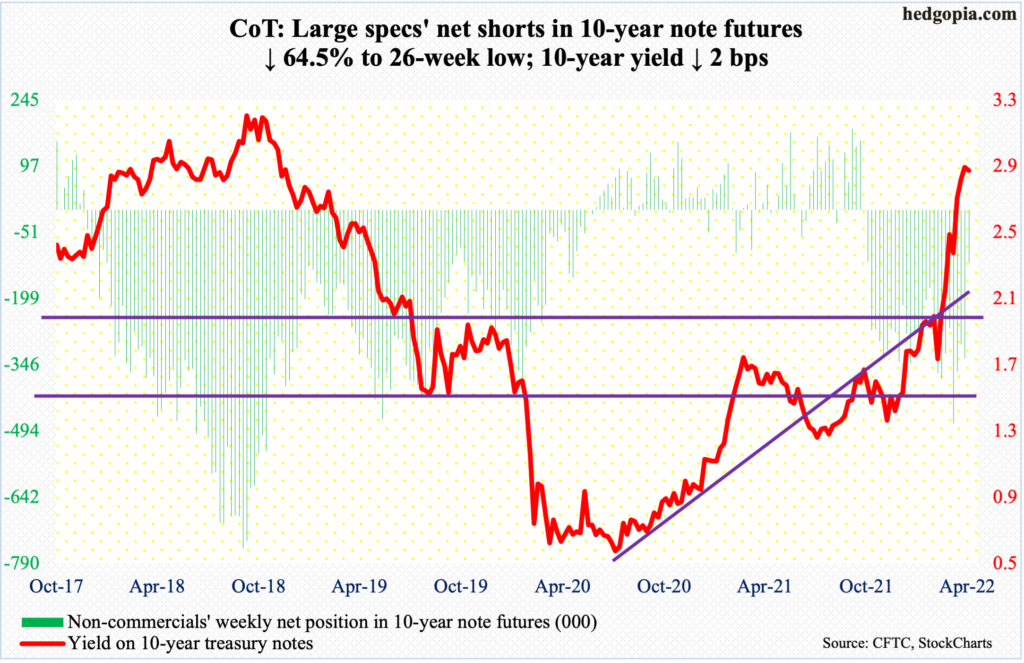
The FOMC meets next week. This will be the year’s third, and five more remain after this. In the March meeting, the fed funds rate was pushed up by 25 basis points to a range of 25 basis points to 50 basis points. This was the first hike since December 2018. There will be many more in the current cycle.
Inflation is running hot. In the 12 months to March, headline and core PCE – out Friday – jumped 6.6 percent and 5.2 percent respectively, with headline PCE steepest since January 1982; February’s 5.3 percent was the fastest rate of core PCE since April 1983.
In late March, Jerome Powell, Fed chair, said that the central bank, if necessary, would be open to raising rates by a half-point at multiple FOMC meetings, adding that it could get “restrictive” to slow economic growth and possibly raise the unemployment rate to tame high inflation. Since that meeting, the hawkish meter has gone up several more notches.
Reading the tea leaves, futures traders have aggressively priced in the benchmark rates to reach 275 basis points to 300 basis points by December and 350 basis points to 375 basis points by July next year. One wonders what that would do to US capacity utilization/growth outlook.
Amidst this, we got the GDP numbers for 1Q this Thursday. Real GDP unexpectedly contracted 1.4 percent, giving fodder for proponents of stagflation. It will be interesting to find out next Wednesday how Powell views this. Is this enough for a softer inflation-fighting language? Likely not. What this may end up doing for now is put the brakes on continued rise in hawkishness.
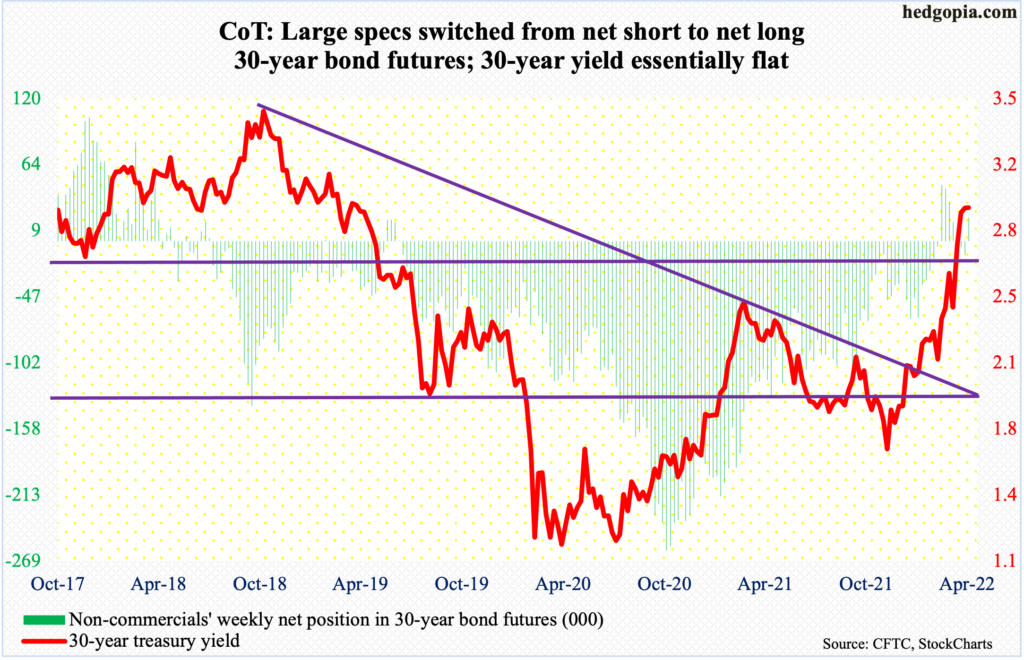
30-year bond: Currently net long 20.1k, up 31.3k.
Major economic releases for next week are as follows.
The ISM manufacturing index (April) comes out on Monday. Manufacturing activity in March fell 1.5 percentage points month-over-month to 57.1.
Job openings (JOLTs, March) and durable goods orders (March, revised) are scheduled for Tuesday.
Non-farm openings dropped 17,000 m/m in February to 11.3 million.
Orders for non-defense capital goods ex-aircraft – proxy for business capex plans – rose one percent m/m to a seasonally adjusted annual rate of $80.8 billion, which set a new record.
Wednesday brings the ISM non-manufacturing index (April). March services activity grew 1.8 percentage points m/m to 58.3 percent.
Labor productivity (1Q22) will be out on Thursday. Non-farm output per hour increased 1.9 percent y/y in 4Q21 – a two-quarter high.
Payrolls (April) are on deck for Friday. In the first three months, a monthly average of 562,000 non-farm jobs has been created; this exactly matches the monthly average last year.
WTI crude oil: Currently net long 322.9k, down 2.4k.
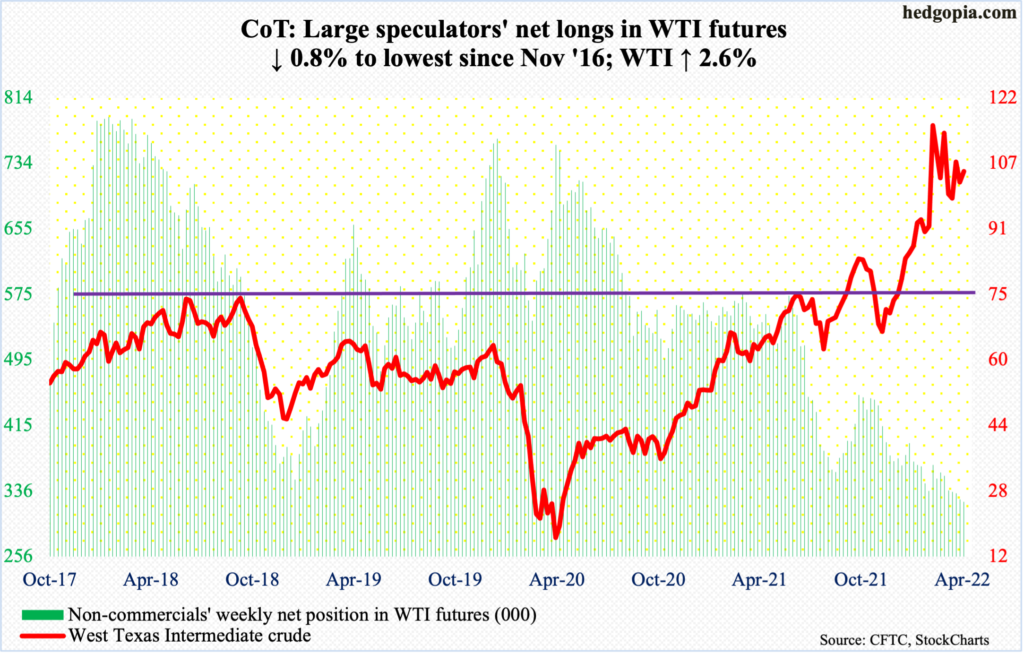
WTI ($104.69/barrel) continued to straddle the 50-day. This has gone on for a month now. This week, it closed below the average in the first three sessions and above in the remaining two.
The crude has posted lower highs since it peaked at $130.50 on March 7, including this week’s intraday high of $107.99 on Friday. It has concurrently found support at $94-$95, forming a descending triangle in the process.
A decisive breach of the triangle – should one unfold – should begin to favor the bears. In this scenario, there is straight-line support at $85, followed by the 200-day at $83.
In the meantime, US crude production in the week to April 22 was unchanged at 11.9 million barrels per day. Crude imports rose 97,000 b/d to 5.9 mb/d. As did crude inventory, which increased 691,000 barrels to 414.4 million barrels. Stocks of gasoline and distillates, however, dropped – respectively down 1.6 million barrels and 1.4 million barrels to 230.8 million barrels and 107.3 million barrels. Refinery utilization fell seven-tenths of a percentage point to 90.3 percent.
E-mini S&P 500: Currently net long 122.8k, up 54.3k.
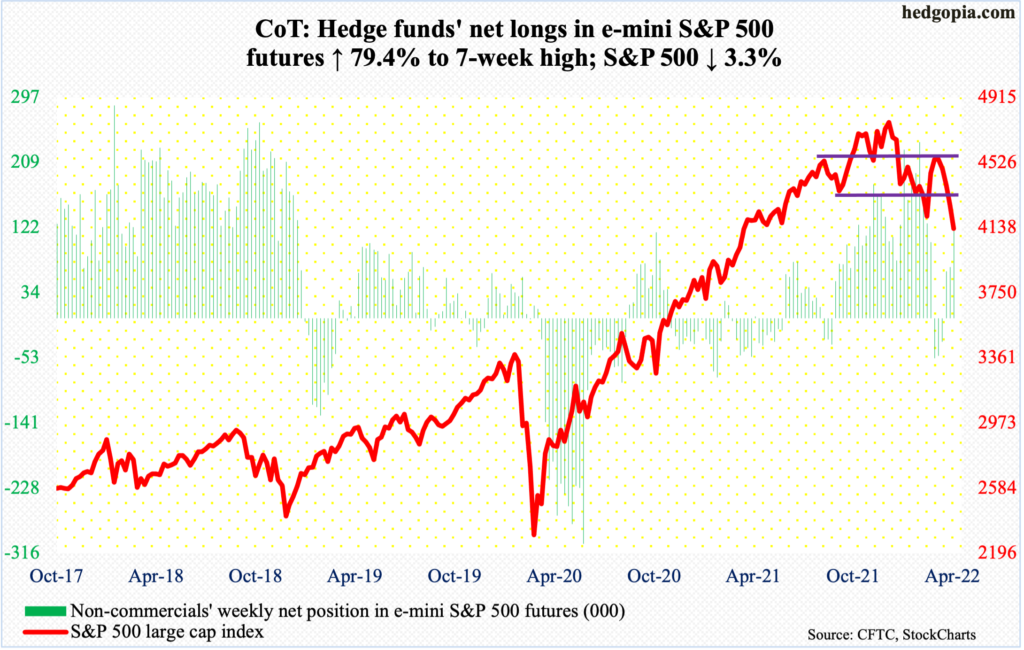
Bulls vigorously sought to defend the February/March lows in the first four sessions, but Friday’s 3.6-percent plunge left the S&P 500 right on that support.
On February 24, the large cap index tagged 4115, down 14.6 percent from the all-time high of 4819 posted on January 4. Then on March 8 and 14, it dropped to 4158 and 4162. On Wednesday this week, the index ticked 4163 before bids showed up. The next day, it shot up 2.5 percent. On Friday, it closed at 4132, with a low of 4124.
Conditions are way oversold – the daily in particular. A relief rally is due (more on this here). Odds of this happening go up meaningfully should the support in question not get breached.
On the way down, the S&P 500 lost several supports, including both the 50- and 200-day. Shorter-term averages are still pointing down, so there is plenty of repair work ahead.
In ideal circumstances, a falling trend line from the January 4 peak gets tested around 4560. This is about where a 61.8-percent Fibonacci retracement of the January-February decline lies (4550, to be exact).
Funds have suffered decent outflows the past several weeks. In the couple of weeks to April 20, US-based equity funds lost $24.3 billion (courtesy of Lipper); during the same period, SPY (SPDR S&P 500 ETF), VOO (Vanguard S&P 500 ETF) and IVV (iShares Core S&P 500 ETF) lost $28.3 billion (courtesy of ETF.com). This week – that is, in the week to Wednesday – $8.8 billion left US-based equity funds, while the three ETFs collected $48 million. Bulls should find this as an improving trend.
Euro: Currently net long 22.2k, down 9.1k.
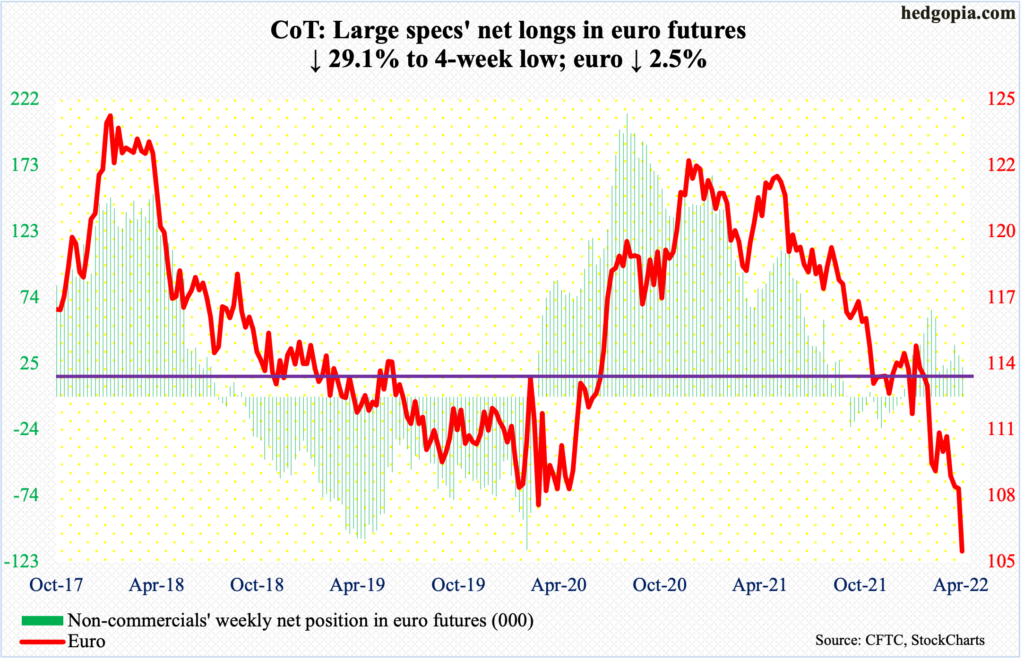
April was brutal. The euro ($1.0547) tumbled 4.7 percent in the month. Straight-line support at $1.05-$1.06 was slightly breached, as the currency tagged $1.0471 on Thursday. In January 2017, it fell as low as $1.0341.
Given the imminent interest-rate differential between the US and the eurozone, as the Federal Reserve sounds much more hawkish than the European Central Bank, traders are now talking of the euro reaching a parity with the dollar.
The euro has been in a downward spiral since it peaked at $1.2345 in January last year. The downward momentum is yet to be broken. It remains oversold on nearly all timeframes.
Should it begin to rally near term, there is gap-down resistance at $1.0580s, which is within striking distance, followed by $1.0750s.
Gold: Currently net long 218k, down 21.7k.
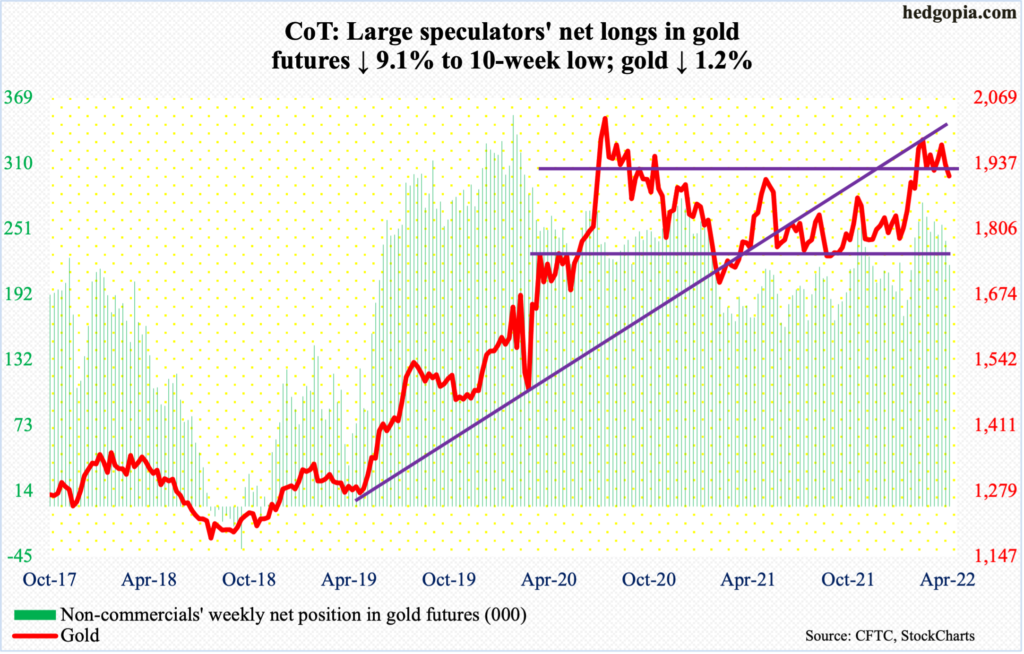
Gold bugs could no longer hold the fort. Crucial support at $1,920s was breached on Monday.
In September 2011, gold ($1,912/ounce) retreated after tagging $1,924. It then bottomed in December 2015 at $1,045. That high was not surpassed until July 2020, followed by a new all-time high of $2,089 a month later.
Early in March (this year), $1,920s was recaptured; by the 8th, bulls were less than $11 short of the August 2020 high, before sellers showed up in numbers.
From bulls’ perspective, even though they were unable to save $1,920s, lower support at $1,870s was defended on Thursday. If a rally ensues, what happens at $1,920s will obviously be a tell; Friday’s high of $1,921 was sold.
Nasdaq 100 index (mini): Currently net long 15.8k, up 7.7k.
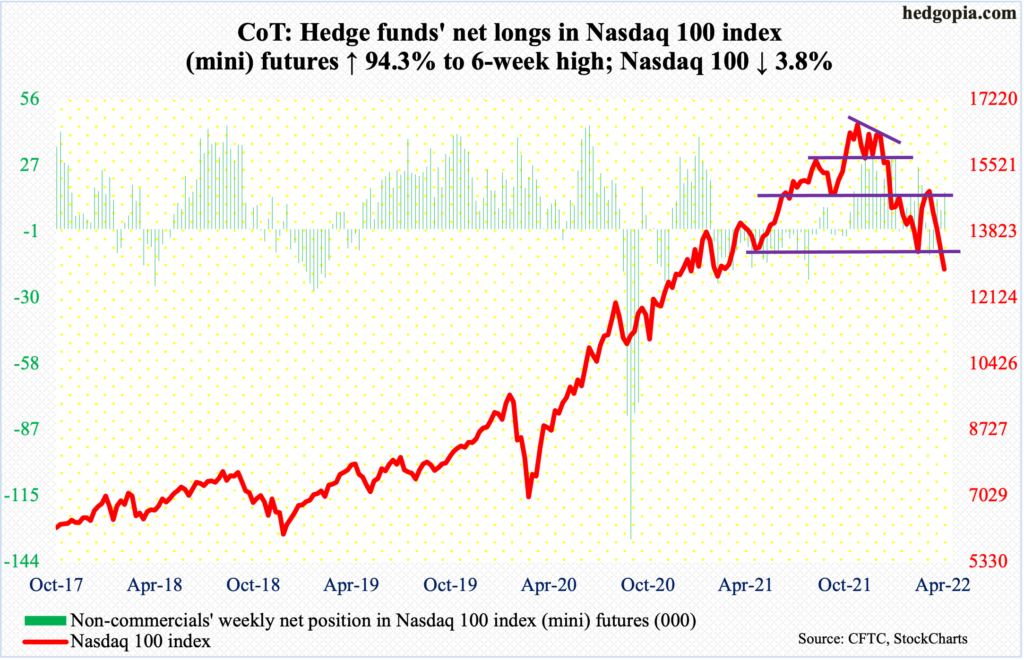
The five major tech companies reporting 1Q this week drew mixed reaction. In the post-earnings session, Microsoft (MSFT) was up, Google owner Alphabet (GOOG) was down, Facebook owner Meta Platforms (FB) was up, and both Amazon (AMZN) and Apple (AAPL) were down.
When it was all said and done, the Nasdaq 100 suffered a fourth straight down week. The tech-heavy index gave back 3.8 percent this week, reversing from up 1.4 percent at Thursday’s high. With the week closing at 12855, there has been a slight breach of the February/March lows (13065 and 13020 respectively). If things do not stabilize soon, this can just act as a self-fulfilling prophecy.
In the event a rally ensues – if nothing else but to unwind the existing oversold conditions – there is plenty of room for short-covering. Nasdaq short interest rose to a fresh high mid-April (more on this here), and shorts are sitting on tons of paper profit.
Russell 2000 mini-index: Currently net short 44.3k, up 3.9k.
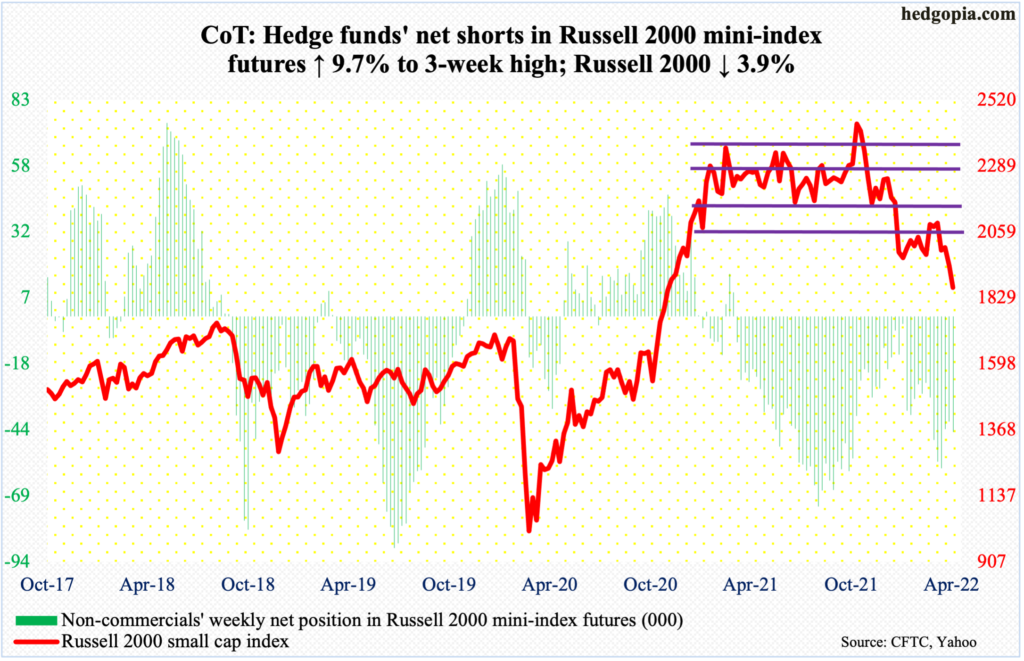
Three-month horizontal support at 1900 suffered a breach this week. On Friday, the Russell 2000 ticked 1861 intraday to close at 1864. With this, the small cap index dropped out of yet another established range between 2080s and 1900.
Earlier, mid-January, the index suffered a rectangle breakdown. From March last year through January, the Russell 2000 went back and forth between 2350s and 2080s, and between 2280s and 2150s within this box. On Nov 3, it broke out but was quickly followed by a failed retest on the 19th that month. Then came the breakdown and a double bottom at/near 1900 in late January and late February.
A backtest of the broken box took place several times during late March and early April – unsuccessfully. Ideally, bulls would like another go at it. But before that happens, they now need to recapture 1900 first.
US Dollar Index: Currently net long 33.9k, up 1.3k.
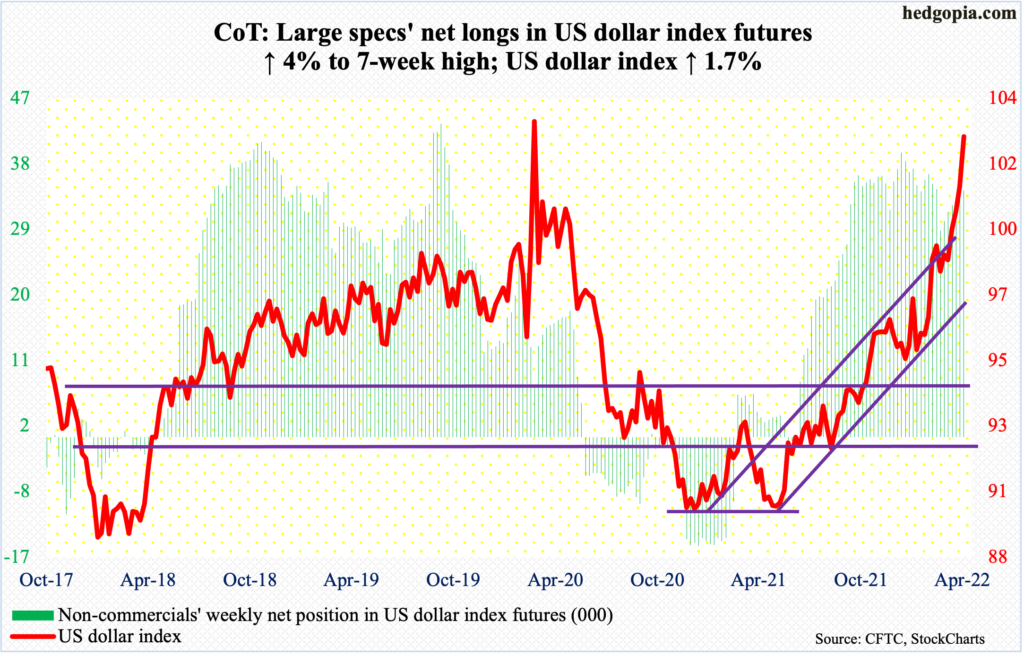
The US dollar index is probing a five-year resistance. In January 2017, it hit 103.81. Then in March 2020, 103.96 was touched. On both those occasions, the index subsequently came under sustained pressure.
Once again, the index hit this potential roadblock. On Thursday, it rose as high as 103.95 before closing at 103.66. Such is the upward momentum currently that only seven sessions ago – on the 21st – the index hit 99.81.
There is a parabolic look to it. Plus, conditions – on nearly all timeframes – are way extended. With resistance of this significance having just been tested, the path of least resistance is down – magnitude and duration notwithstanding.
VIX: Currently net short 72.2k, down 3.7k.
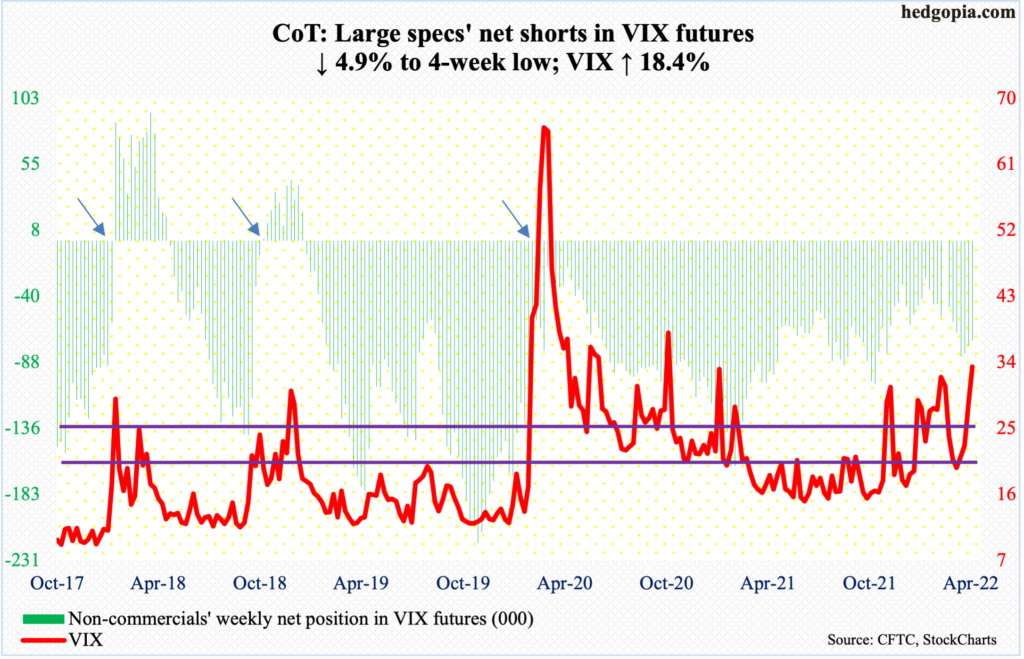
VIX ended the week at 33.40, with Friday’s session high of 34.34. This is yet another low since January this year when the volatility index hit 38.94.
However, on a closing basis, VIX has trended higher – with higher lows and higher highs – for the past several months.
In the past, spike reversals have routinely acted as signals to short volatility. Thus far, there has been none, although the daily is grossly overbought.
In the event volatility retreats, nearest support lies at mid-20s, which coincides with the 50-day at 26.23, and after that low-20s, which approximates the 200-day at 21.50.


