
This Week's CoT: Futures And What Hedge Funds Are Buying
Following futures positions of non-commercials are as of May 11, 2021.
10-year note: Currently net long 1.2k, up 8.5k.
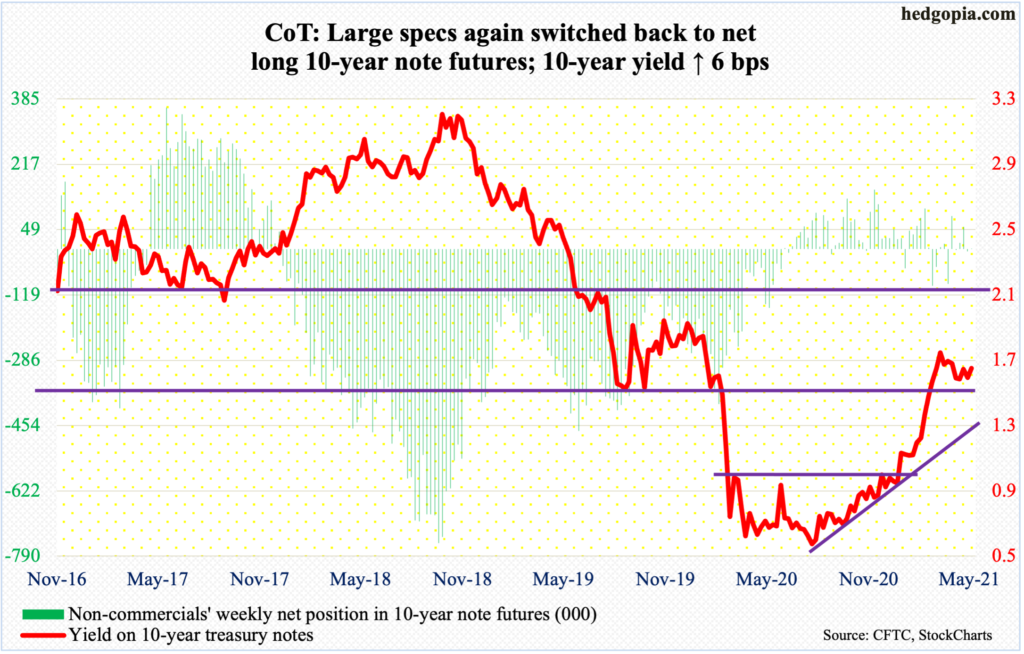
FOMC minutes for the April 27-28 meeting will be made public on Wednesday. The meeting was a non-event – pretty much. The fed funds rate was left untouched at a range of zero to 25 basis points, as were monthly purchases of at least $80 billion of treasury notes and bonds and $40 billion of mortgage-backed securities. This was expected.
Thus, the minutes are not likely to contain anything that will surprise the markets. If anything, April’s CPI report – out on Wednesday – already accomplished that. Headline inflation surged 4.2 percent year-over-year last month, which was the fastest pace since September 2008, coming in way hotter than the consensus; core CPI similarly jumped three percent – the highest since January 1996.
The bigger question is if this would change the Fed’s policy stance (more on this here). Not likely. This is one month’s data. Besides, the central bank has said all along that it expects – even wants – inflation to run hotter than its two percent objective. Speaking the same morning post-CPI report, Vice-Chair Richard Clarida said he was “surprised” by the jump in inflation but stressed that this would prove transitory.
More important is equities’ reaction function. The kneejerk reaction on Wednesday was ‘sell first and ask questions later’. The Fed, bitten by the wealth effect, will start to worry if selling persists. The pedal is already to the metal – be it using conventional or unconventional tools. In this scenario, the task of tempting equity investors to take on risk and go up the risk curve becomes herculean. Right here and now, Jerome Powell and the team need not worry. Buy-the-dip mentality is intact.
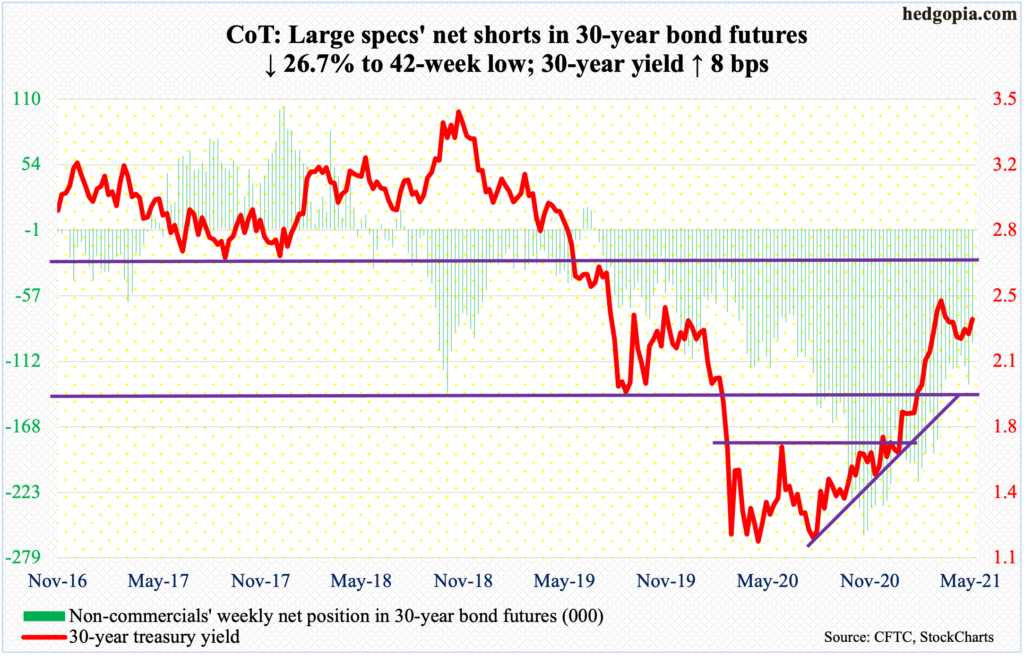
30-year bond: Currently net short 96.6k, down 35.2k.
Major economic releases for next week are as follows.
The NAHB Housing Market Index (May) and Treasury International Capital data (March) will be published on Monday.
Homebuilder optimism in April increased a point month-over-month to 83. Earlier in November last year, the index reached a record high 90, three times the low hit in April last year.
In the 12 months to February, foreigners purchased $376.8 billion in US equities – a record. This is quite a reversal from April 2019 when they sold $214.6 billion worth – also a record.
Housing starts (April) are due out on Tuesday. Starts surged 19.4 percent m/m in March to a seasonally adjusted annual rate of 1.74 million units – the highest since June 2006.
Friday brings existing home sales (April). In March, sales dropped 3.7 percent m/m to 6.01 million units (SAAR). Last October, sales hit 6.73 million, having earlier dropped to 4.01 million in May.
WTI crude oil: Currently net long 537.8k, down 13.4k.
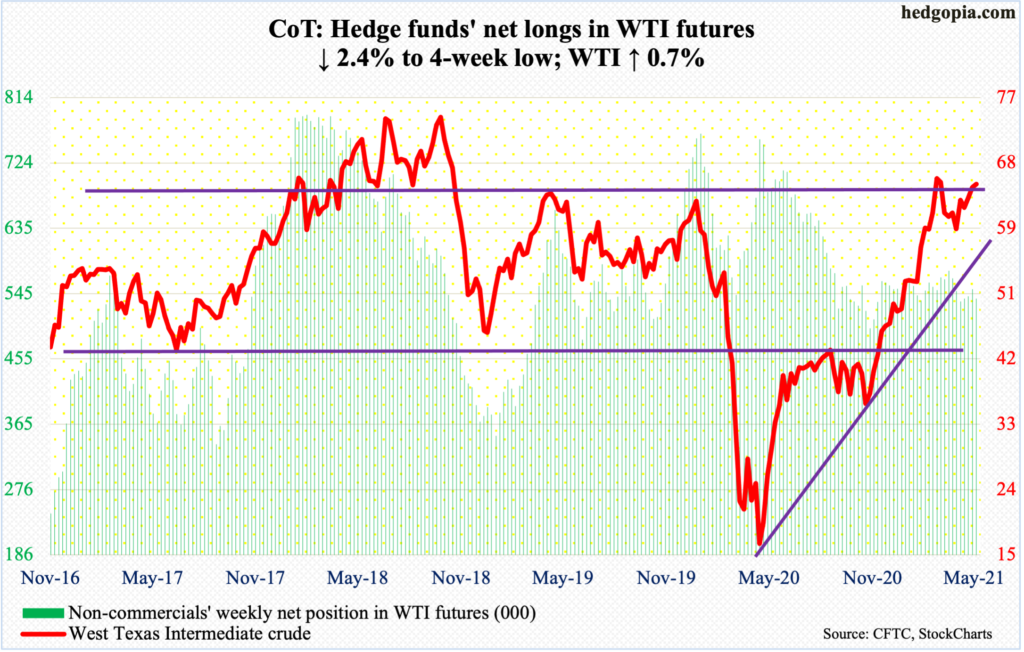
Once again, oil bulls were denied at $66-$67. On Wednesday, WTI ($65.37/barrel) ticked $66.63 before retreating; a week before that, sellers showed up after the crude touched $66.76.
The daily remains overbought. The 50-day at $63 has gained significance. The average also approximates a rising trend line from March. A loss of this support can hasten a move toward $58. Alternatively, a decisive $66-$67 breakout opens the door toward mid-$70s.
In the week to May 7, US crude production increased 100,000 barrels per day to 11 million b/d. As did crude imports, which were up 37,000 b/d to 5.5 mb/d. Gasoline stocks rose as well – up 378,000 barrels to 236.2 million barrels. Refinery utilization dropped four-tenths of a percentage point to 86.1 percent. Stocks of crude and distillates, however, fell – down 1.8 million barrels and 1.7 million barrels respectively to 236.2 million barrels and 134.4 million barrels.
E-mini S&P 500: Currently net short 36.8k, up 3k.
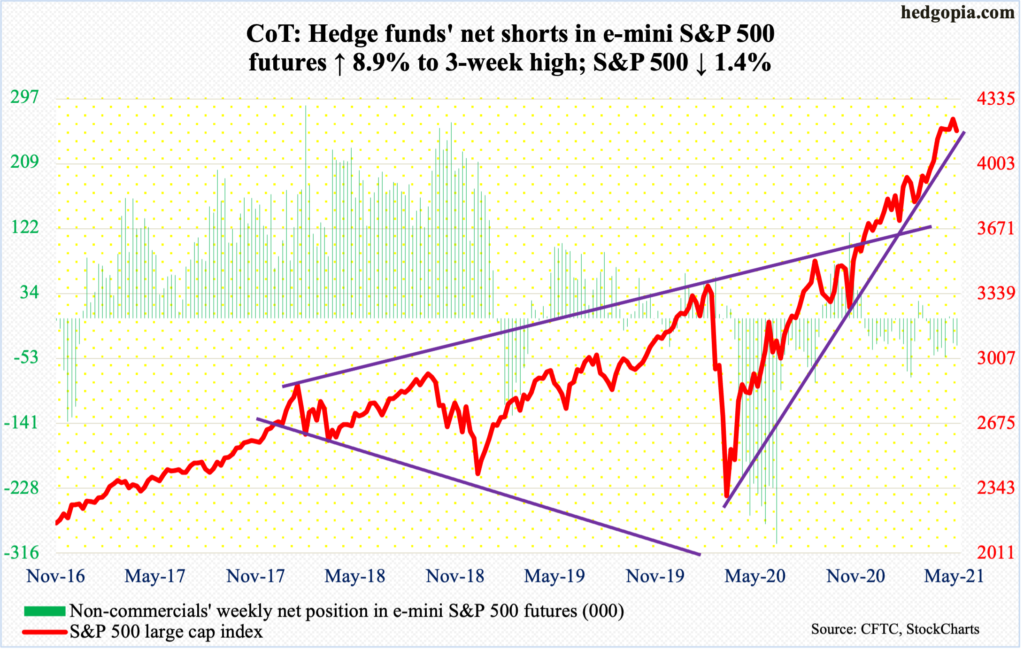
Since reclaiming the 50-day (4064) in late April last year, the S&P 500 (4173.85) has tested the average eight times and is yet to breach it on a sustained basis. On Wednesday, the day the large cap index tumbled 2.1 percent, the average was just about tested – successfully.
At the lows, the index was down 4.2 percent, breaching a rising trend line from the low of March last year, but bulls regrouped to rally to only lose 1.4 percent for the week. The trend line was saved.
On the daily, there is room to rally more.
Medium term, both weekly and monthly – way overbought – have tons of unwinding left. This week’s action produced another weekly hanging man; the pattern was also formed last week. This followed a gravestone doji before that and a dragonfly doji the week before. These are potentially bearish candles and need confirmation.
Euro: Currently net long 93.9k, up 9.1k.
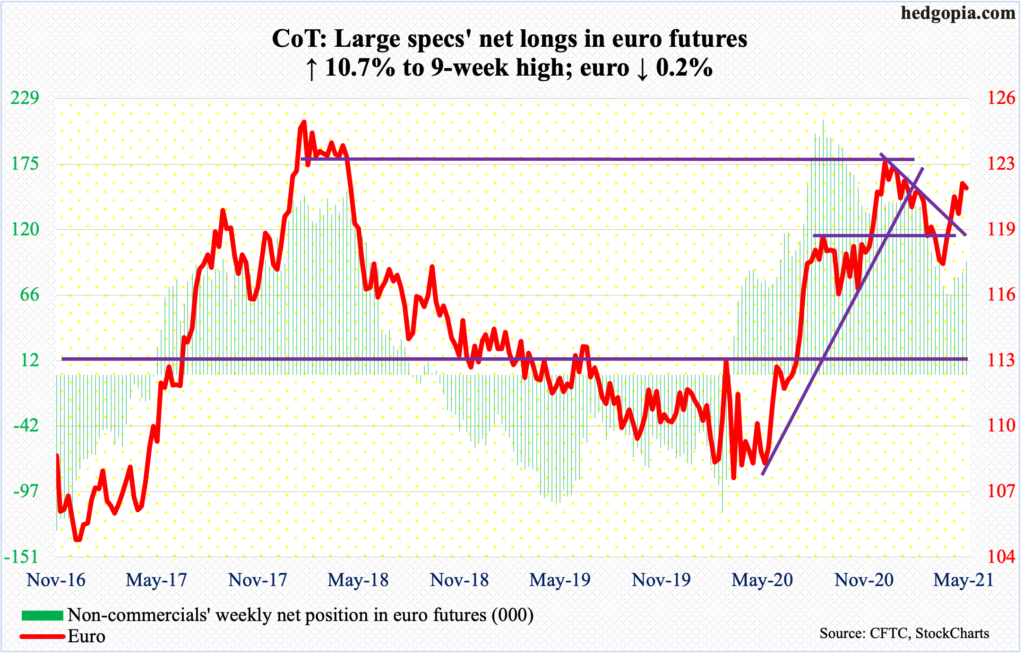
The euro ($1.2141) hit the wall just under $1.22 for three consecutive sessions before retreating on Wednesday. It is still comfortably above horizontal support at $1.19-$1.20, which goes back 18 years.
Last week, the currency broke through a falling trend line from January 6 when it ticked $1.2345. A loss of $1.19-$1.20 will have negated the breakout.
Gold: Currently net long 192.3k, up 21.5k.
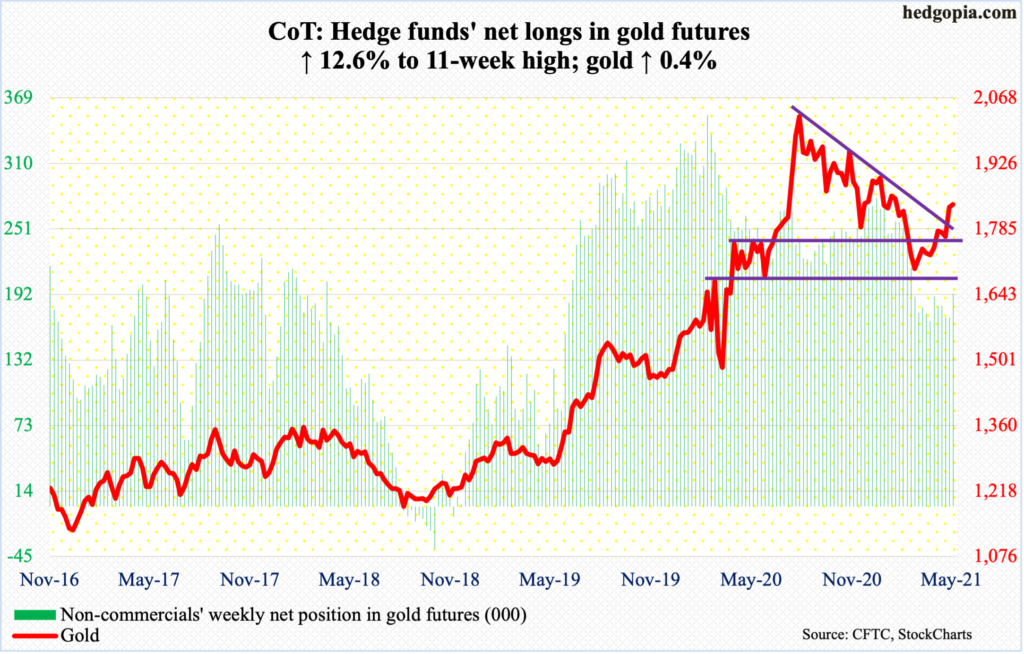
Gold ($1,838.10/ounce) on Friday rose as high as $1,847.10 to just about test its 200-day ($1,854). The average is flattish, even as the 50-day ($1,757) is now rising. The 200-day also lines up with horizontal resistance at $1,850s.
Gold has hammered on $1,840s for six sessions now. The metal is itching to break out.
In the week to Wednesday, for the first time in 16 weeks, GLD (SPDR Gold ETF) saw positive flows, gaining $340 million (courtesy of ETF.com). In the prior 15, $8.7 billion was redeemed.
In the meantime, non-commercials raised net longs in gold futures to a 11-week high.
Last week, the metal jumped 3.6 percent after repeatedly defending $1,760s-$1,770s. As long as this level is intact, it is gold bugs’ ball to lose. Nearest support lies at $1,800, and of course $1,760s-$1,770s after that.
Nasdaq 100 index (mini): Currently net short 6k, down 10.8k.
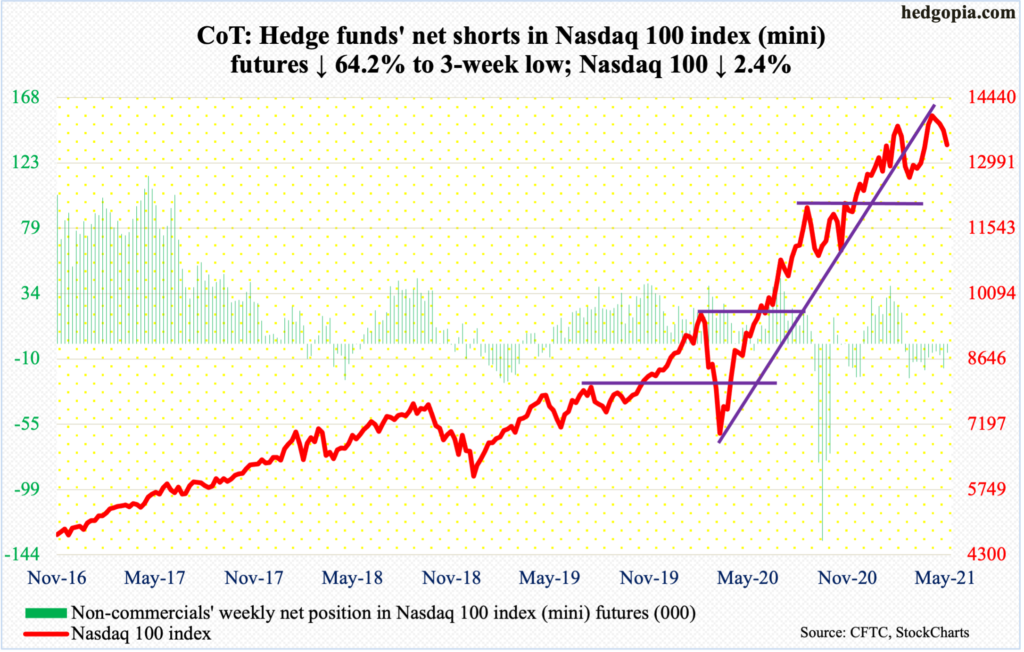
Since bottoming on March 5, the Nasdaq 100 has made higher lows, including the one this Wednesday when it tagged 12967.18. By then, the tech-heavy index was down 7.8 percent from the intraday high of 14073.48 posted on April 29.
For the week, the index (13393.12) lost 2.4 percent, having impressively recovered from down 5.5 percent at the lows to close right on the 50-day.
The daily can rally. But the medium- to long-term picture is worsening. The index already breached a rising trend line from the low of March last year, starting January with a monthly long-legged doji, followed by a dragonfly doji in February and a gravestone doji in March. It tried to negate all these potentially bearish candles by rallying 5.9 percent in April, but with 10 sessions to go this month, the Nasdaq 100 is down 3.4 percent.
Russell 2000 mini-index: Currently net short 27.8k, up 4.7k.
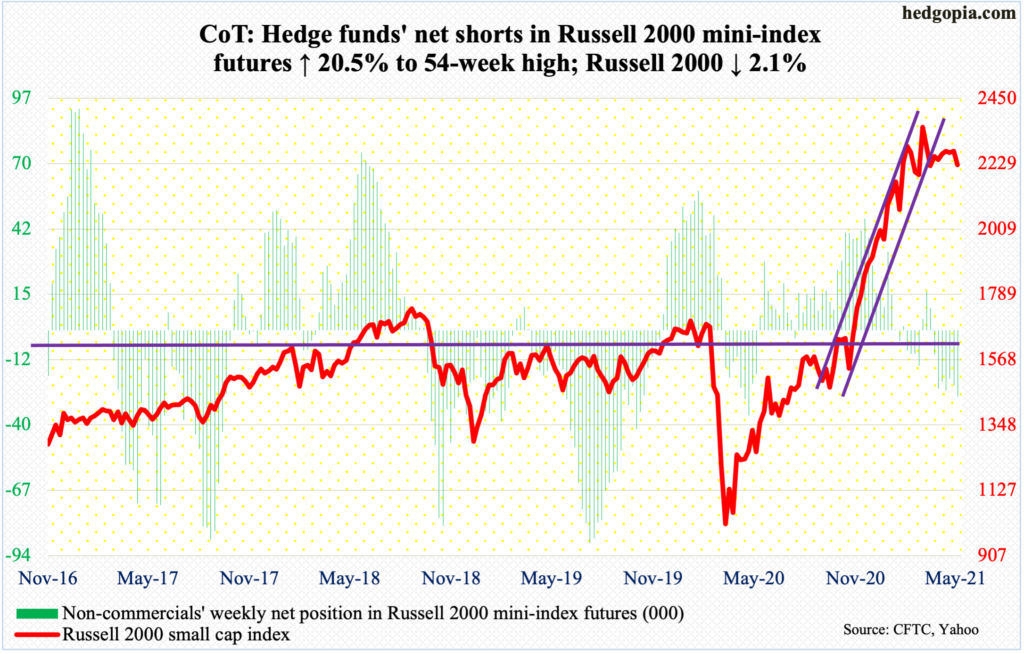
On Wednesday, when the Russell 2000 tumbled 3.3 percent, the neckline of a potentially bearish head-and-shoulders formation was just about tested, with the session low of 2132.25 and the neckline at 2070s-2080s. On Thursday, Wednesday’s low was tested again before bolting higher.
Despite the potential for near-term strength, small-caps remain on the defensive. The Russell 2000 (2224.63) remains under the March 15 record high of 2360.17 and has breached an ascending channel from last October-November.
There is decent straight-line resistance at 2280s.
US Dollar Index: Currently net long 2.4k, up 368.
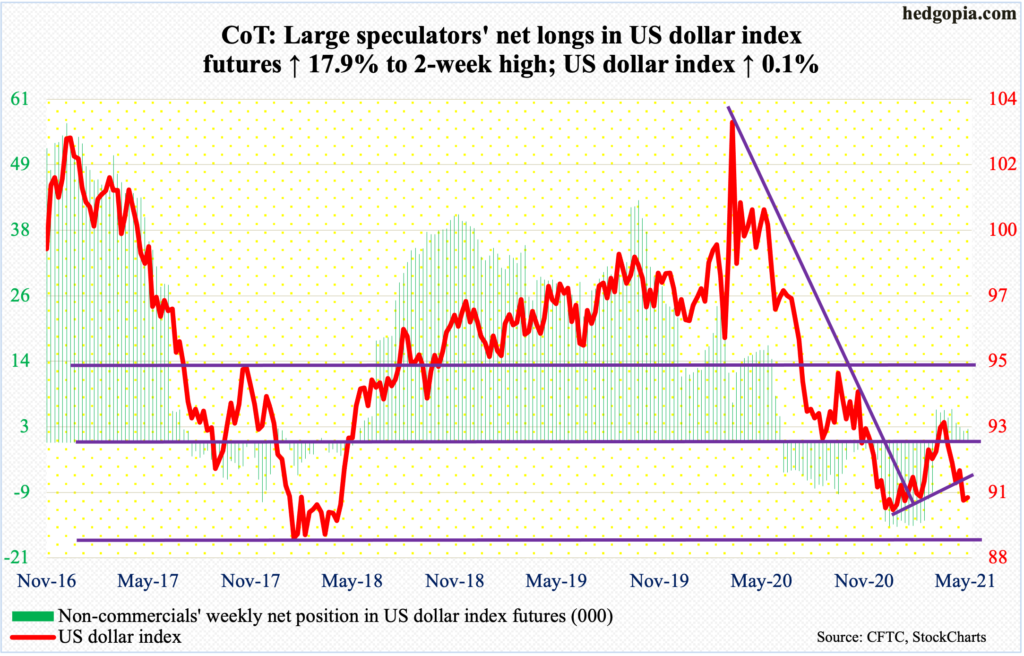
A rising trend line from January 6 when the US dollar index (90.32) bottomed at 89.17 has been lost – again. The support was breached last Friday, but only to see it recaptured this Wednesday and then lost again on Friday.
On Tuesday, the index ticked 89.96. Support at 88-89 goes back at least 17 years. This is a must-save.
VIX: Currently net short 87.2k, down 9.5k.
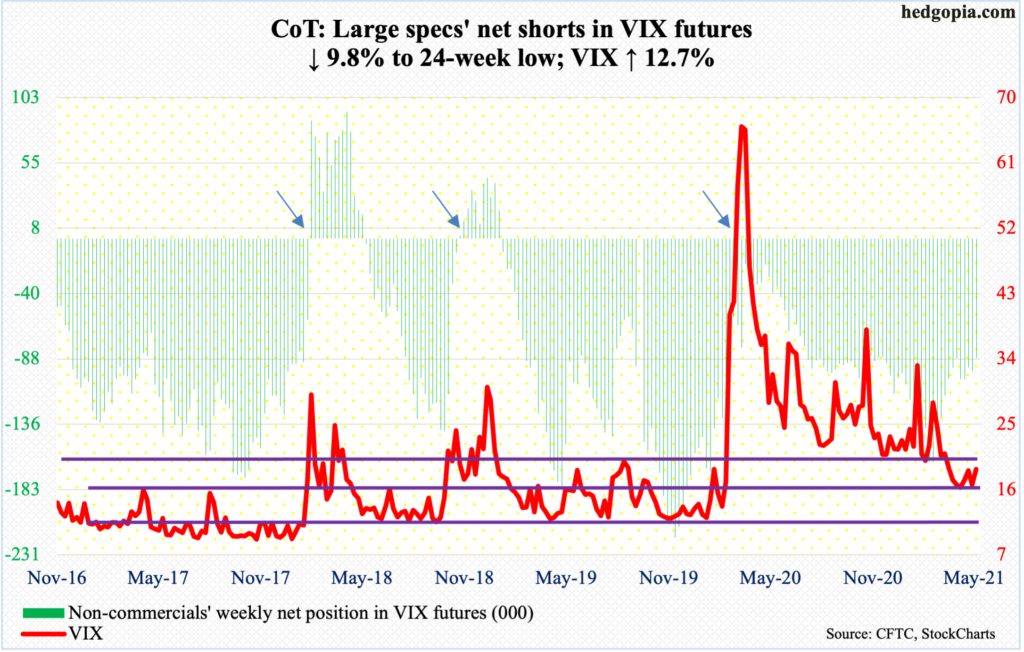
In a matter of four sessions this week, VIX shot up 12.14 points through Thursday’s intraday high of 28.93. Then, it gave up 10.12 points by Friday’s close. Talk about volatility.
The volatility index closed above the 200-day on Wednesday but just for a session. Volatility bulls were unable to hang on to Thursday’s gains, reversing sharply lower.
Thursday’s spike reversal represents yet another lower high since March last year when VIX (18.81) spiked to 85.47 before reversing.
As things stand, it is probably eyeing mid-teens.


