
This Week's Commitment Of Traders: What Hedge Funds Are Buying
Following futures positions of non-commercials are as of March 29, 2022.
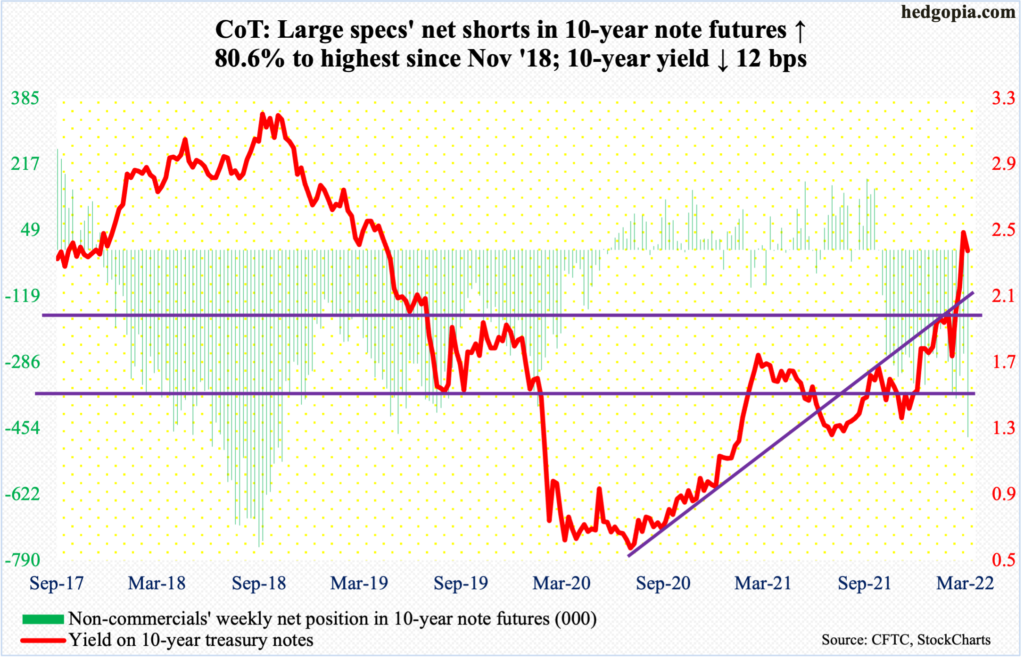
10-year note: Currently net short 476.6k, up 212.7k.
FOMC minutes for the March 15-16 meeting are scheduled for Wednesday. At the meeting, the Federal Reserve raised the fed funds rate by 25 basis points to a range of 25 basis points to 50 basis points. This was the first increase in the benchmark rate since December 2018. The dot plot signaled six more hikes this year – essentially one each in the remaining six scheduled meetings.
The Fed also said it would announce a plan during the May 3-4 meeting to shrink its pool of assets, which has ballooned from $4.24 trillion in early March 2020 to $8.94 trillion. So, it is going to be a double whammy – higher rates (conventional tool) and reduced balance sheet (unconventional).
Then, last Monday (March 28), Jerome Powell, Fed chair, sounded much more hawkish than he did at the post-FOMC press conference. He said that the central bank, if necessary, would be open to raising rates by a half-point at multiple FOMC meetings, adding that it could get “restrictive” to slow economic growth and possibly raise the unemployment rate to tame high inflation. Fed funds futures are currently pricing in a 69-percent probability of a 50-basis-point hike on May 4.
With this as a background, not much can probably come out this week to move – or surprise – the markets. Ahead of this, the 10-year treasury yield, which finds itself amidst interesting dynamics (more on this here), tagged 2.5 percent both this week and last, with the week closing at 2.38 percent.
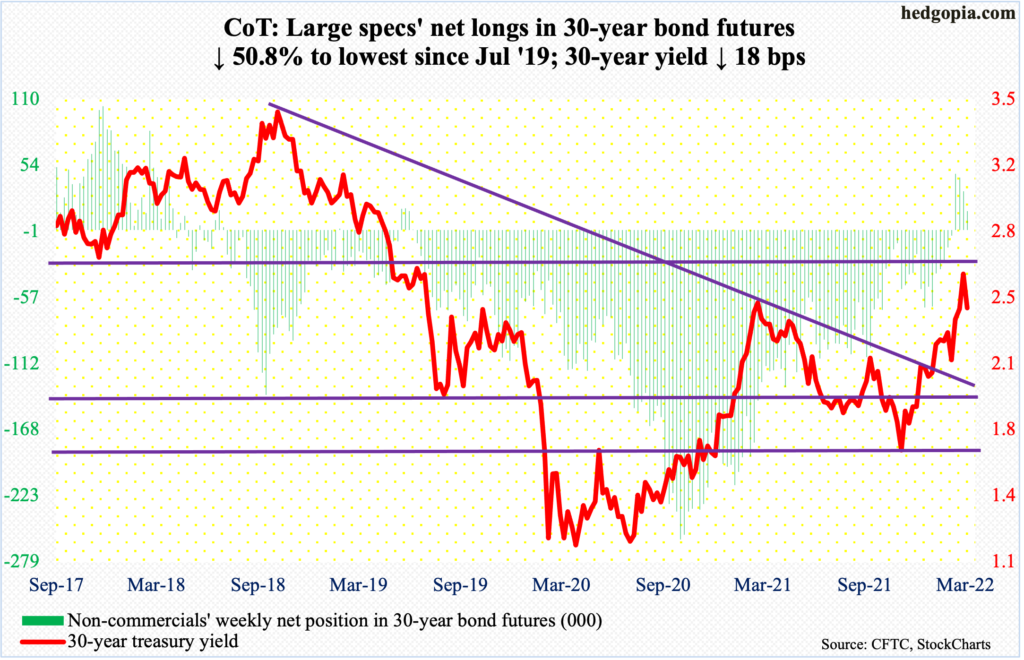
30-year bond: Currently net long 16k, down 16.6k.
Major economic releases for next week are as follows.
Factory orders (February) are due out on Monday. Preliminarily, February orders for non-defense capital goods ex-aircraft – proxy for business capex plans – fell 0.3 percent month-over-month to a seasonally adjusted annual rate of $80.1 billion. This was the first monthly drop in 12 months. January’s $80.3 billion was a record.
The ISM non-manufacturing index (March) is scheduled for Tuesday. Services activity declined 3.4 percentage points m/m in February to 56.5 percent.
WTI crude oil: Currently net long 336.2k, down 18.3k.
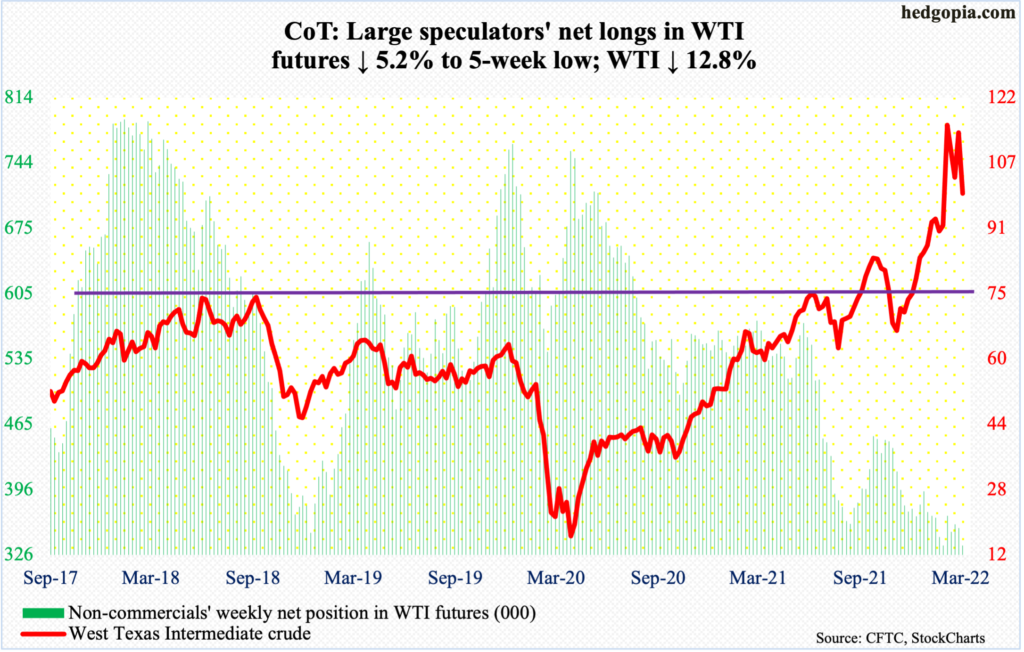
Starting in May, the Biden administration will release one million barrels per day a month of crude for six months from the Strategic Petroleum Reserve. This will be the third time the US would have tapped the SPR in the past six months. WTI rallied from $61.74 last August to last month’s high of $130.50. So, a lasting impact from the SPR release is anyone’s guess. However, the planned 180 million barrels will constitute the largest release in the near 50-year history of the SPR, which currently holds 568.3 million barrels.
Ahead of this, US crude inventory in the week to March 25 rose 100,000 b/d to 11.7 million b/d; in the prior seven weeks, it remained unchanged at 11.6 mb/d. Crude imports dropped 227,000 b/d to 6.3 mb/d. Crude inventory fell as well, down 3.4 million barrels to 410 million barrels. Stocks of gasoline and distillates, however, rose 785,000 barrels and 1.4 million barrels respectively to 238.8 million barrels and 113.5 million barrels. Refinery utilization increased one percentage point to 92.1 percent.
The news of the release put the crude under more pressure, shedding seven percent on Thursday and down 12.9 percent for the week. This was the third negative week in the last four. This week’s action was exacerbated by OPEC+’s Thursday decision to stick with its planned increase of oil output of 432,000 b/d in May.
WTI ($99.27/barrel) ended March up 4.8 percent but with a bearish reversal candle; at the high on the 7th, the crude was up 36.3 percent. It has room for continued unwinding of overbought conditions. A breach of $93-$94 can open the door toward $85 and then the 200-day at $80.38.
E-mini S&P 500: Currently net short 50.9k, down 3.3k.
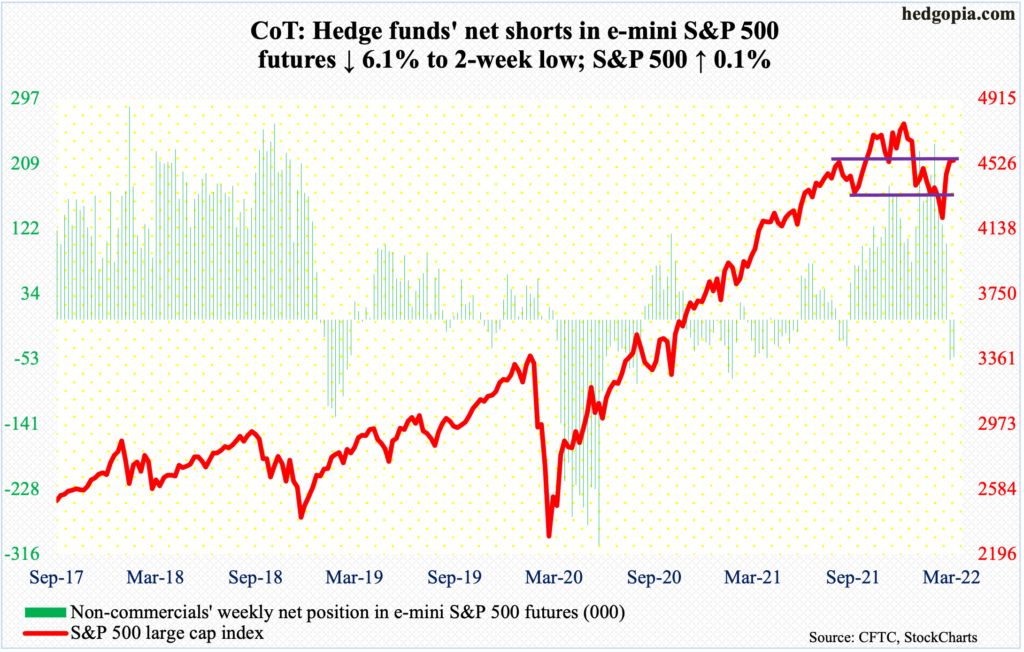
Equity bulls picked up where they left off last week. By Tuesday, the S&P 500 was up 2.1 percent for the week. This preceded an 8.1-percent jump in the prior two weeks. But after Tuesday’s gap-up session, weakness began to brew. By the end of the week, the large cap index (4546) was up only 0.1 percent, essentially closing near dual resistance – seven-month horizontal and 61.8-percent Fibonacci retracement of the January 4-February 24 decline (more on this here).
The daily is extended and likely continues to unwind.
The 200-day moving average is at 4486 and the 50-day at 4412.
Euro: Currently net long 21.4k, down 2.5k.
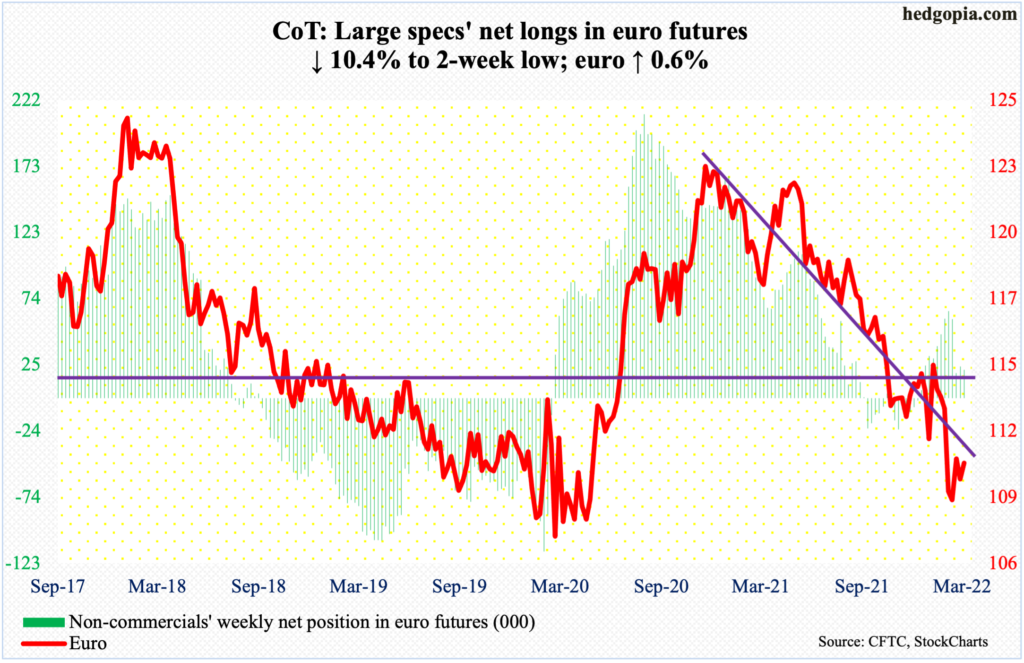
Resistance just under $112 was tested Wednesday as the euro touched $1.1172 intraday, drawing sellers. At $1.1176 also lies the 50-day.
The currency ($1.1050) likely comes under pressure in the sessions ahead. On the 7th, it bottomed at $1.0845, before putting in higher lows; Monday’s low of $1.0947 thus has gained on significance, while Tuesday’s gap-up will be filled at $1.10.
Gold: Currently net long 257.6k, up 9.6k.
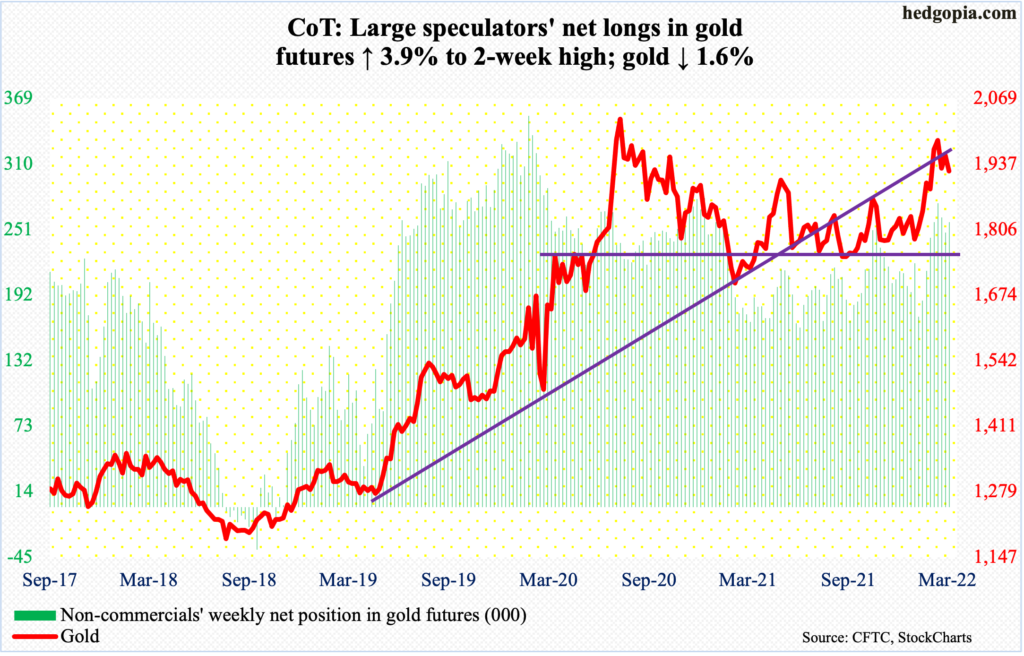
The 50-day ($1,898) drew bids on Tuesday, with the session dropping to $1,893 intraday but closing at $1,918. This also constituted a successful defense of $1,920s.
In September 2011, gold ($1,924/ounce) retreated after touching $1,924. Subsequently, the metal bottomed in December 2015 at $1,045. That high was not surpassed until July 2020, followed by a new all-time high of $2,089 a month later.
Early in March, bulls reclaimed $1,920s, which led to further strength; by the 8th, they were less than $11 short of the August 2020 high, before offers overwhelmed bids. So far, bulls have defended the breakout retest. So long as the price remains above this level, it is their ball to lose.
As things stand, there is resistance at $1,950s.
Nasdaq 100 index (mini): Currently net short 11.2k, up 14k.
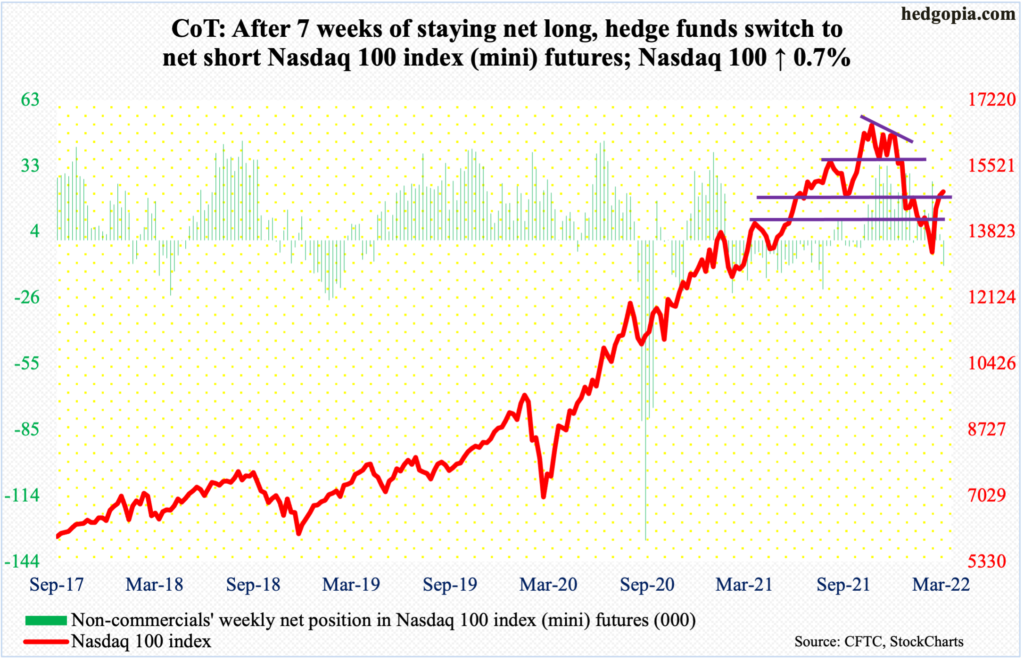
The Nasdaq 100 reclaimed the 200-day on Tuesday but only to be pushed back under it in the very next session. From the March 14 low through Tuesday’s high, the index jumped 17 percent. This preceded a 22.3-percent drop between last November’s record high and last month’s low.
The 200-day also coincided with horizontal resistance at 15100s. Incidentally, Tuesday’s high of 15265 also approximated a 61.8-percent retracement of the November 2021-March 2022 decline at 15334.
Bulls were unable to power past the triple resistance. At Tuesday’s high, the index was up 3.5 percent but ended the week up only 0.7 percent, producing a weekly shooting star.
There is room for continued move lower. The daily is overbought. The 50-day lies at 14303.
Russell 2000 mini-index: Currently net short 55.7k, up 8.3k.
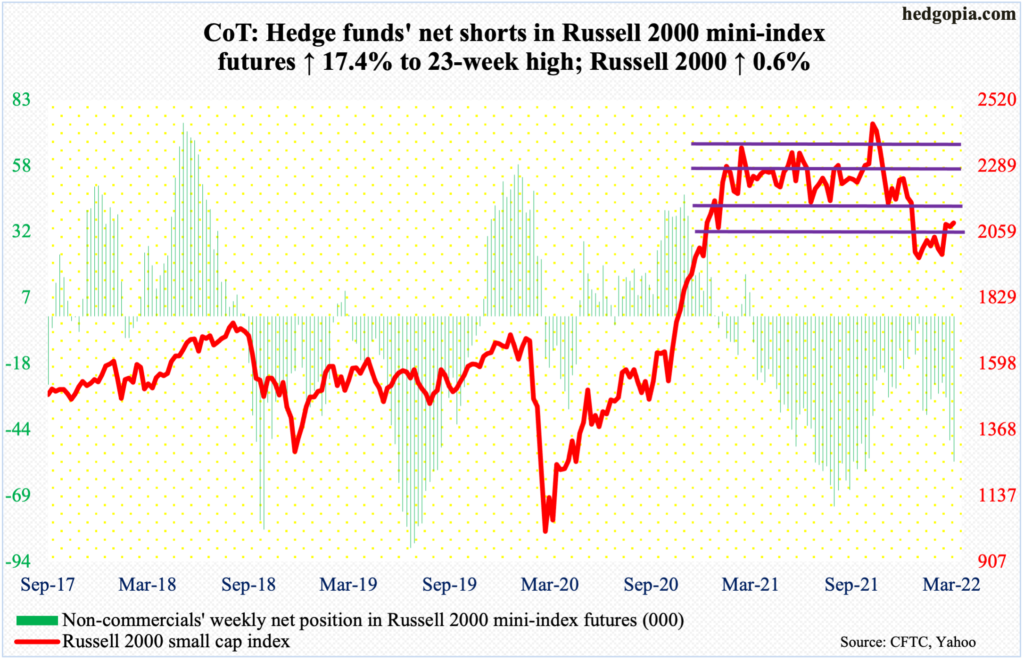
After hammering on the bottom range of a broken rectangle for several weeks, the Russell 2000 came to life this week but had no staying power.
From last March through January, the small cap index was rangebound between 2350s and 2080s, and between 2280s and 2150s within this box. On Nov 3, it broke out but was quickly followed by a failed retest on the 19th (November). Soon followed a range breakdown in January; selling stopped near 1900, with a possible double bottom in late January and late February.
On both Tuesday and Wednesday this week, the index (2091) rallied to 2130s, with Tuesday ticking 2138. But the strength would not last. It closed out the week at 2091. There is short-term support at 2050s.
US Dollar Index: Currently net long 30.9k, up 1.3k.
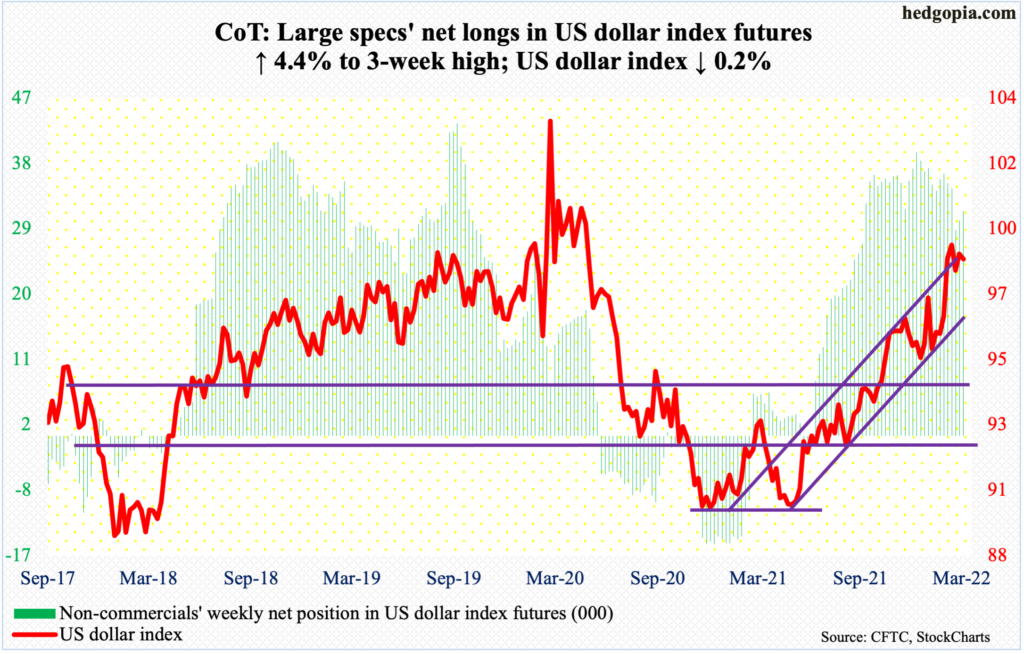
Dollar bulls once again went after the March 7 high of 99.42, with Monday tagging 99.36 and Tuesday 99.42, but no breakout. At the same time, bids continued to show up at 97.70s, which was touched both Wednesday and Thursday. It so happens that 97.70s also approximates the 20-day.
Thus, for now, the US dollar index (98.63) is stuck between that support and last month’s high, with an upward bias in the sessions ahead.
VIX: Currently net short 65.9k, up 7.5k.
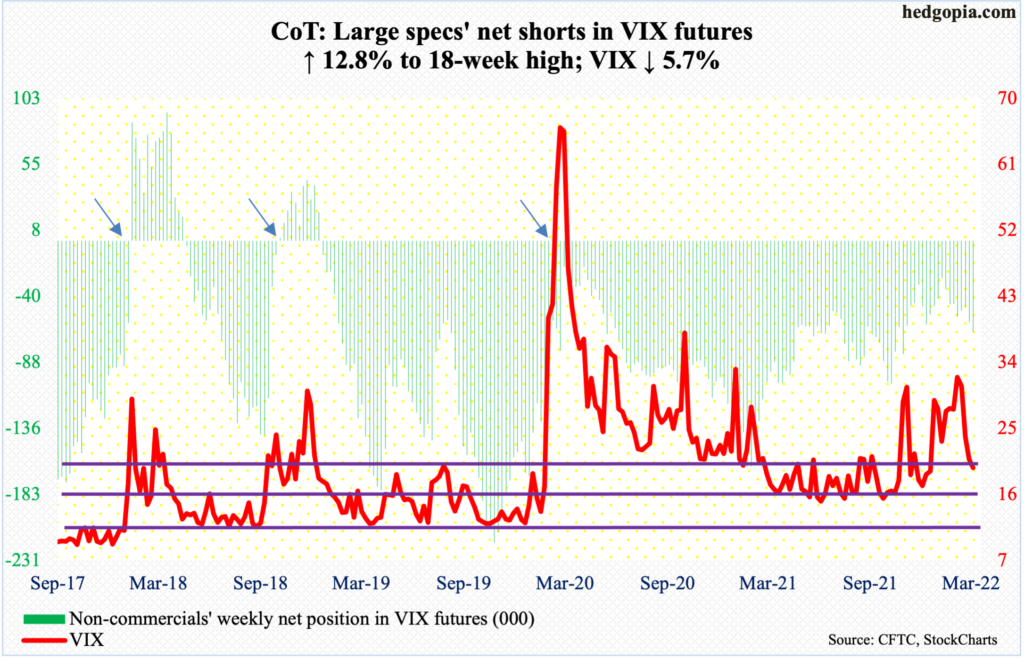
March was tough for volatility bulls, as VIX gave back 9.59 points, with a range of 37.52 and 18.67; the monthly low was printed on Tuesday. On Monday, the volatility index lost the 200-day (20.74).
The daily – grossly oversold – is itching to rally. Reclaiming of the 200-day, which also approximates horizontal resistance at low-20s, will be the first step toward that. The next hurdle is mid-20s.


