
This Week's Commitment Of Traders - Futures, Hedge Fund Buying
Following futures positions of non-commercials are as of April 20, 2021.
10-year note: Currently net long 15.6k, up 18.3k.
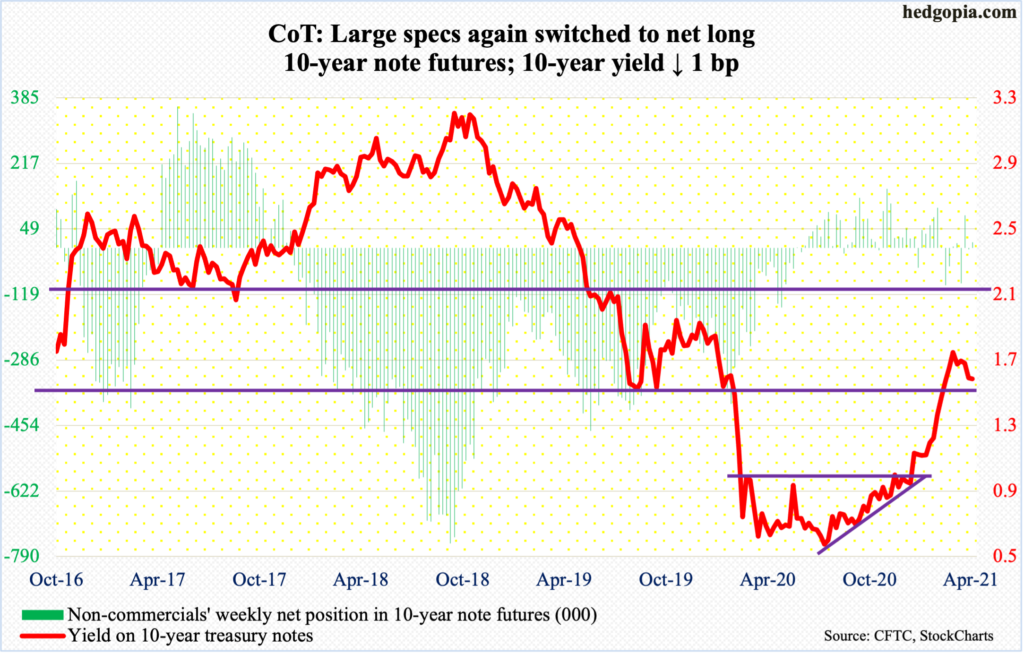
The FOMC meets next week. It is the year’s third meeting; five more remain – the scheduled ones, that is. Not a whole lot is expected to come out of this meeting.
In the March meeting, members already updated their economic projections. This year’s real GDP growth forecast was raised to 6.5 percent from 4.2 percent last December; core PCE inflation forecast went from 1.8 percent to 2.2 percent. The Fed continues to believe the pickup in inflation is transitory; it is expected to moderate next year.
Markets more or less agree. The University of Michigan’s survey respondents expect next year’s inflation at 3.7 percent but only 2.7 percent in the next five years.
Amidst this have come commentaries on rising cost pressures from several companies including Coca-Cola (KO), Procter & Gamble (PG), Kimberley Clark (KMB), Owens Corning (OC), Waste Management (WM), and DR Horton (DHI). In March, US existing home prices were up 17.2 percent year-over-year to $329,100 – a record.
Markets would want to hear Chair Powell’s take on this.
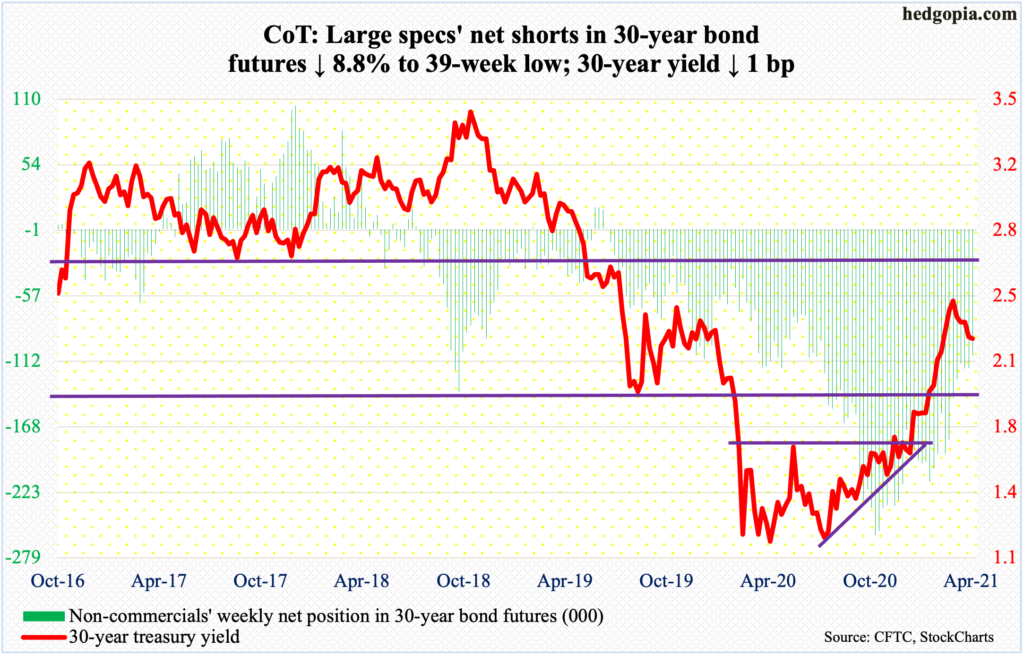
30-year bond: Currently net short 107.6k, down 10.4k.
Major economic releases for next week are as follows.
Durable goods orders (March) will be published on Monday. In the 12 months to February, orders for non-defense capital goods ex-aircraft – proxy for business capex plans – jumped 9.1 percent to a seasonally adjusted annual rate of $72.5 billion. January’s $73.1 billion was a new record.
The S&P Case-Shiller Home Price Index (February) is due out on Tuesday. Nationally, US home prices in January surged 11.2 percent y/y – a 15-year high.
GDP (1Q21, first estimate) is scheduled for Thursday. Real GDP grew 4.3 percent in 4Q20 and 33.4 percent in the quarter before that. This was preceded by contractions of five percent in 1Q and 31.4 percent in 2Q.
Friday brings the employment cost index (1Q21), personal income/spending (March) and the University of Michigan’s consumer sentiment index (April, final).
In 4Q20, private-industry compensation grew 2.6 percent y/y, with wages & salaries rising 2.8 percent and benefits 2.1 percent.
Core PCE, which is the Fed’s favorite measure of consumer inflation, increased 1.41 percent y/y in February. Inflation has not crossed two percent since January 2019.
Preliminarily, April’s consumer sentiment increased 1.6 points m/m to 86.5 – a 13-month high but still below the pre-pandemic high of 101 in February last year.
WTI crude oil: Currently net long 538.2k, up 4.3k.
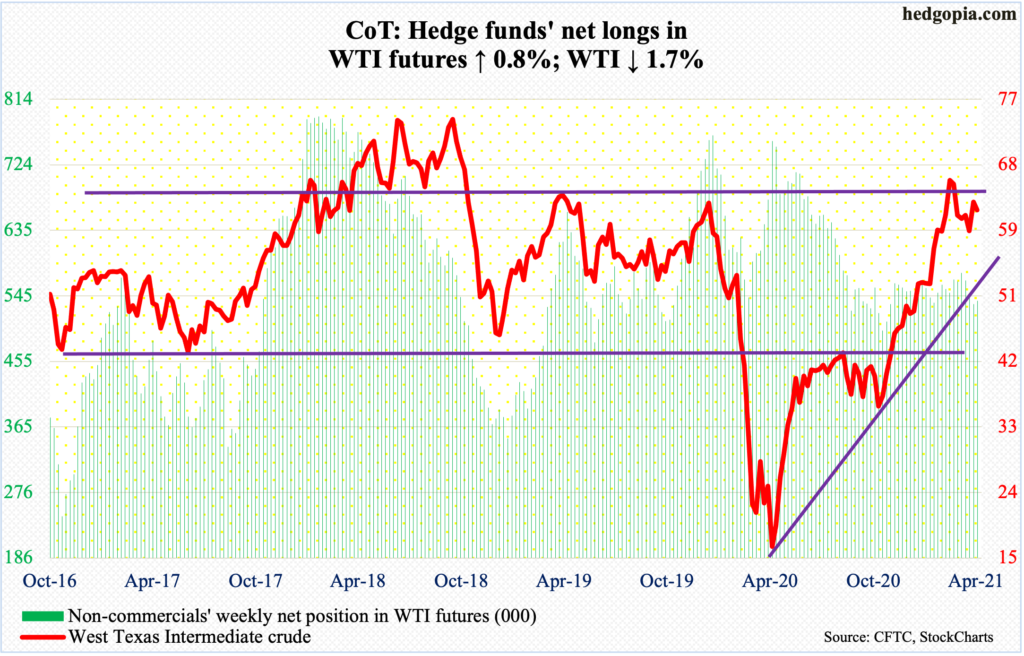
WTI ($62.14/barrel) continues to act like the March 8 high of $67.98 will stand – at least for a while. After hugging the 50-day for nearly four trading weeks, the crude decisively reclaimed the average on Wednesday last week, but the bulls were unable to defend the breakout.
On Tuesday this week, WTI posted a high of $64.38 before coming under pressure. Once again, the 50-day ($61.67) is in play. Throughout this, bids showed up at/near $58, which likely gets tested in the sessions ahead.
In the meantime, crude production was unchanged at 11 million barrels per day in the week to April 16. As was refinery utilization at 85 percent. Crude imports and distillate stocks declined – down 447,000 b/d and 1.1 million barrels respectively to 5.4 mb/d and 142.4 million barrels. In contrast, crude and gasoline stocks rose – up 594,000 barrels and 85,000 barrels to 493 million barrels and 235 million barrels, in that order.
E-mini S&P 500: Currently net short 52.2k, up 12.1k.
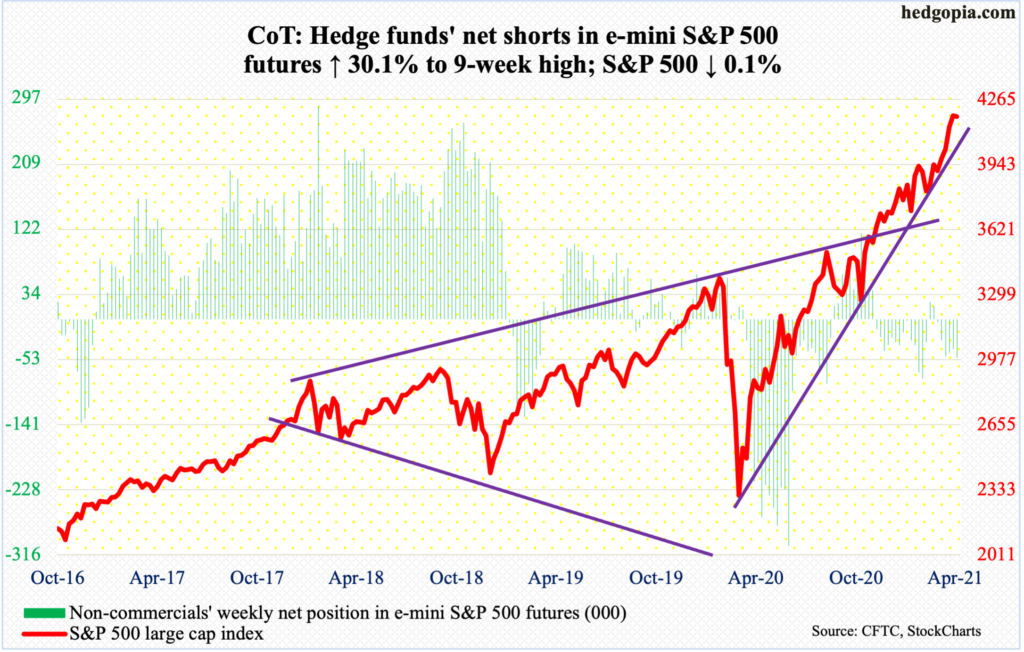
Positive flows into US-based equity funds extended to 11 weeks in a row, for a cumulative total of $107.6 billion, with the week to Wednesday taking in $1.6 billion (courtesy of Lipper). In the same week, SPY (SPDR S&P 500 ETF), VOO (Vanguard S&P 500 ETF) and IVV (iShares Core S&P 500 ETF) pulled in $4.5 billion, for five-week uninterrupted inflows of $18.4 billion (courtesy of ETF.com).
After four up weeks, bulls were unable to extend the streak to five. However, the S&P 500 (4180.17) recovered from down 1.7 percent through Tuesday’s low to end the week down 0.1 percent. There was a lot of whipsaw around the 10-day. In the end, Friday ticked a new high of 4194.17. At the same time, a dragonfly doji was formed on the weekly. This candle can signal a trend reversal but needs confirmation. Next week is key.
Euro: Currently net long 80.8k, up 14k.
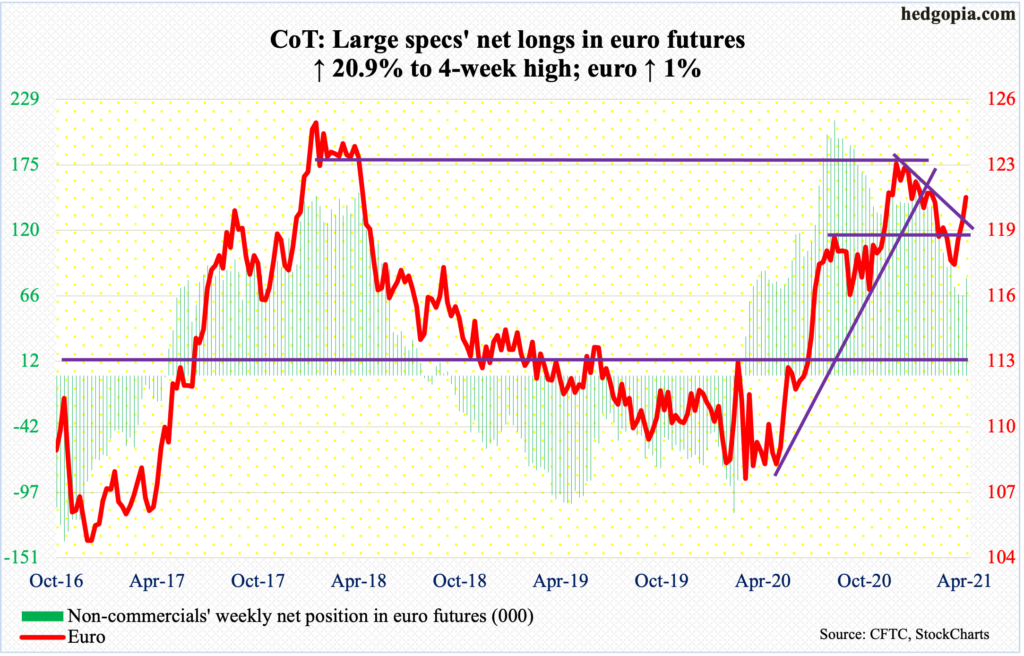
The ECB said it will keep buying more bonds in the coming months than it did in the early months this year. Under its Pandemic Emergency Purchase Program, it plans to make purchases of up to €1.85 trillion until March 2022. It said last month it would increase government bond purchases in order to arrest rising bond yields.
The euro ($1.2099) tried to rally on this on Thursday, tagging $1.2071 but closing at $1.2017; the session high tested a falling trend line from January 6 when the currency ticked $1.2345. Come Friday, the trend line was taken out. With this, euro bulls also broke through horizontal resistance at $1.19-$1.20, which goes back 18 years.
The daily is extended, but momentum lies with the bulls.
Gold: Currently net long 181.5k, up 624.
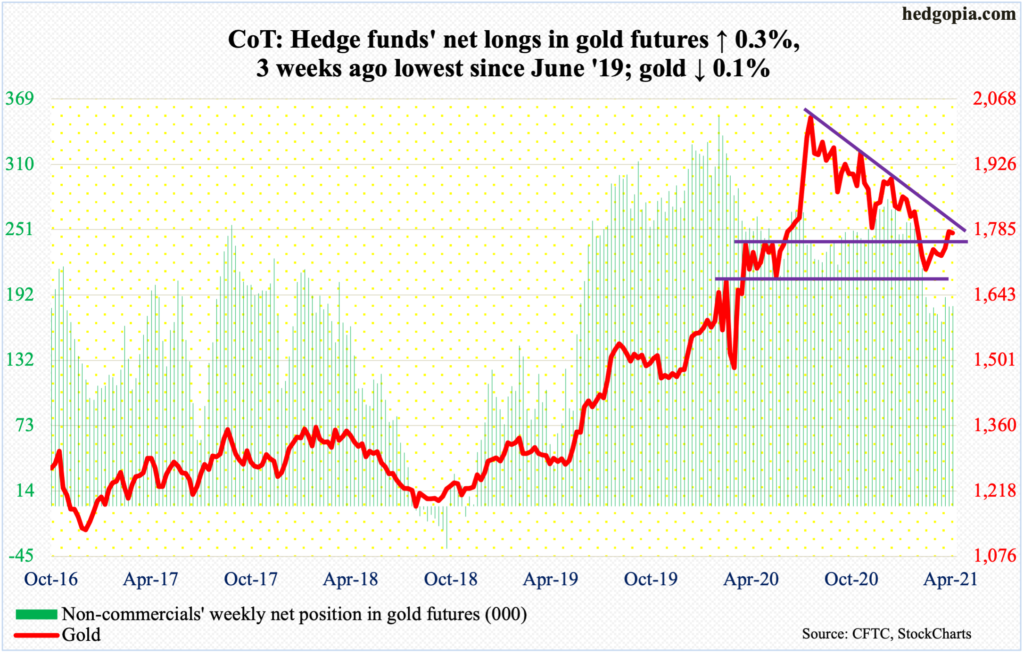
Gold ($1,777.80/ounce) went after trend-line resistance from August 7 last year when it reached its all-time high of $2,089.20 but did not quite make it. In four of the five sessions, the metal rallied into $1,790s and was met with offers.
Flows continued not to cooperate. In the week to Wednesday, $65 million came out of GLD (SPDR Gold ETF). This was the 24th weekly outflows out of the last 27, for cumulative loss of $14.7 billion (courtesy of ETF.com).
Once again, odds favor a test of gold bugs’ mettle at $1,760s-$1,770s, which they reclaimed on the 15th this month.
Nasdaq 100 index (mini): Currently net short 5.1k, down 986.
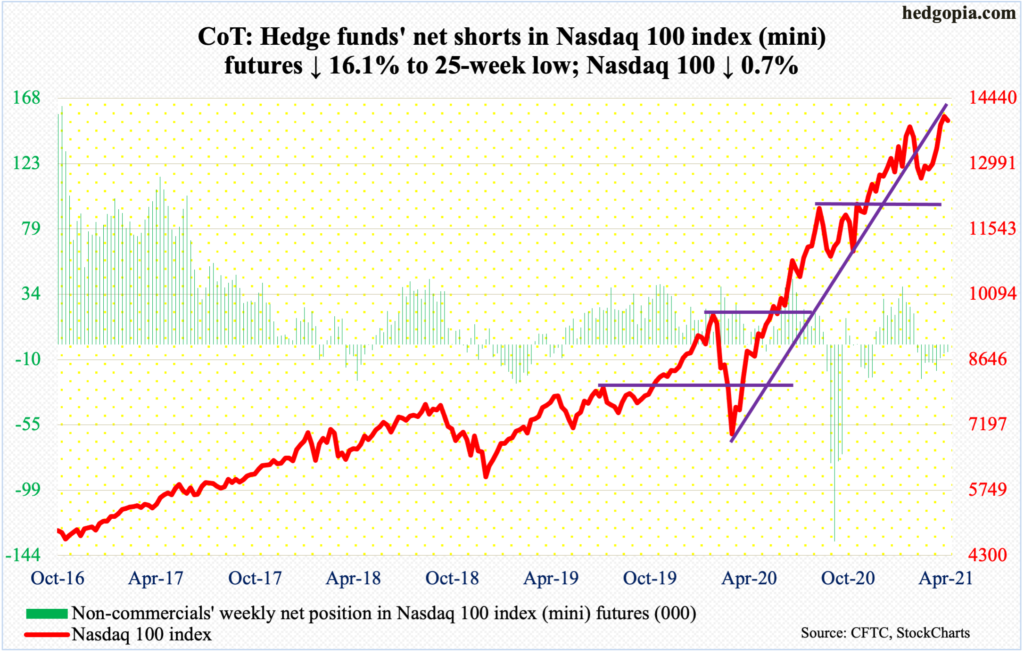
The Nasdaq 100 was unable to build on last week’s momentum in which a new high was recorded. In fact, the tech-heavy index (13941.44) retreated right after last Friday’s intraday high of 14050.38.
This week, there was a lot of back-and-forth around the 10-day. In fact, through Wednesday’s low, it was down 2.3 percent for the week. Friday’s rally helped it cut the loss to a decline of 0.7 percent.
Things unfolded this way ahead of next week’s March-quarter reports from Apple (AAPL), Microsoft (MSFT), Amazon (AMZN), Google owner Alphabet (GOOG/L), Tesla (TSLA) and Facebook (FB). Collectively, the six account for 45 percent of the index, so wield a disproportionately heavy influence (more on this here).
Bulls would not want to see adverse post-earnings reaction. With one week to go, April is so far up 6.5 percent, with a bullish marubozu candle. This comes after three ominous looking monthly candles – a dragonfly doji in March, a shooting star in February and a long-legged doji in January.
Russell 2000 mini-index: Currently net short 25.2k, up 3.7k.
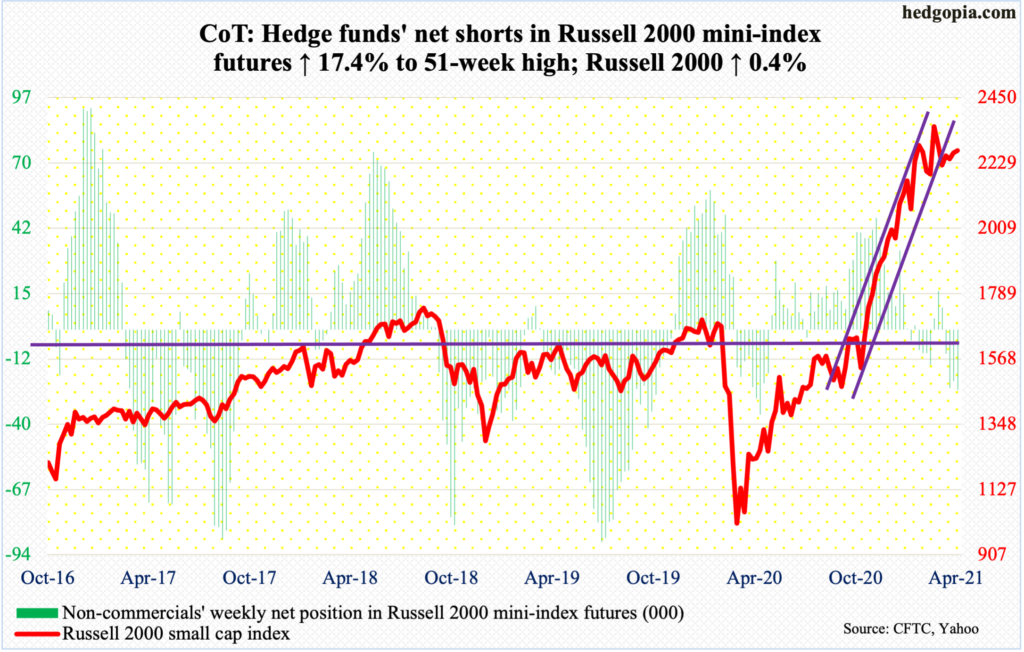
The Russell 2000 continues to work on the right shoulder of a potential head-and-shoulders formation. It is a potentially bearish pattern and will complete once the small cap index (2271.86) breaks the neckline at 2070s-2080s.
An ascending channel from last October-November has already been breached, and the Russell 2000 remains well under its March 15 high of 2360.17. Through that high, it rallied 144 percent. The longer the prevailing lackluster action continues, the higher the temptation to lock in profit.
That said, Friday’s 1.8-percent rally landed the index right on horizontal support at 2270s. A decisive breakout will negate the risks of a head-and-shoulders top.
US Dollar Index: Currently net long 3.5k, down 2.4k.
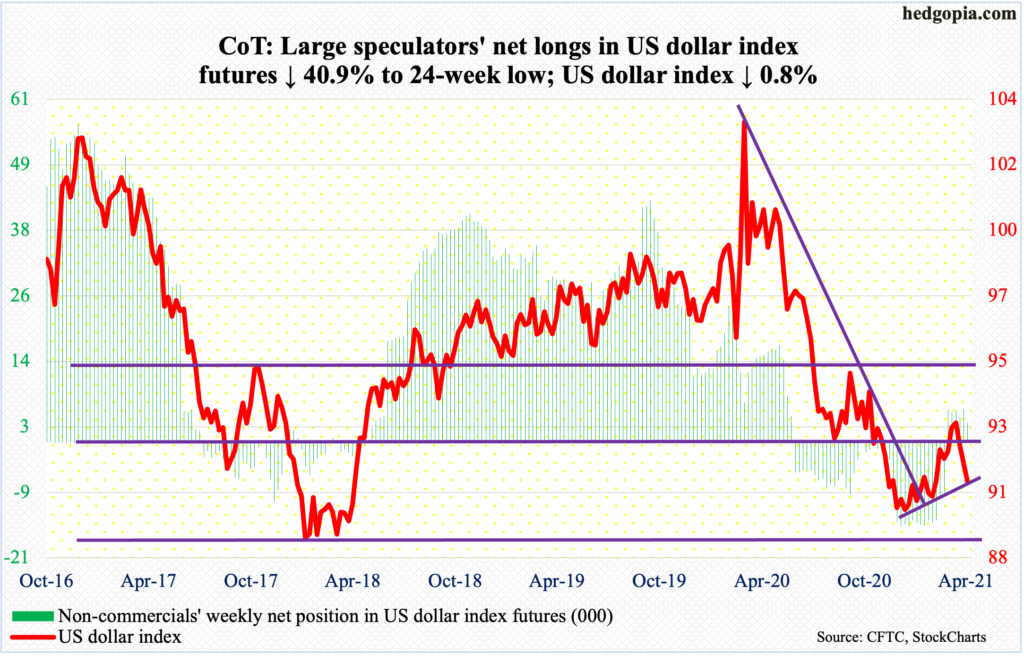
Tuesday’s low of 90.84 successfully tested a rising trend line from January 6 when the US dollar index bottomed at 89.17. This was an important low, as support at 88-89 goes back at least 17 years. After that multi-year low, it rallied all the way to 93.47, which was ticked on March 31. In the subsequent selling, dollar bulls were unable to defend support just north of 92.
In the sessions ahead, it is possible the index breaches the trend line in question and heads toward 88-89 – again.
VIX: Currently net short 102.5k, down 140.
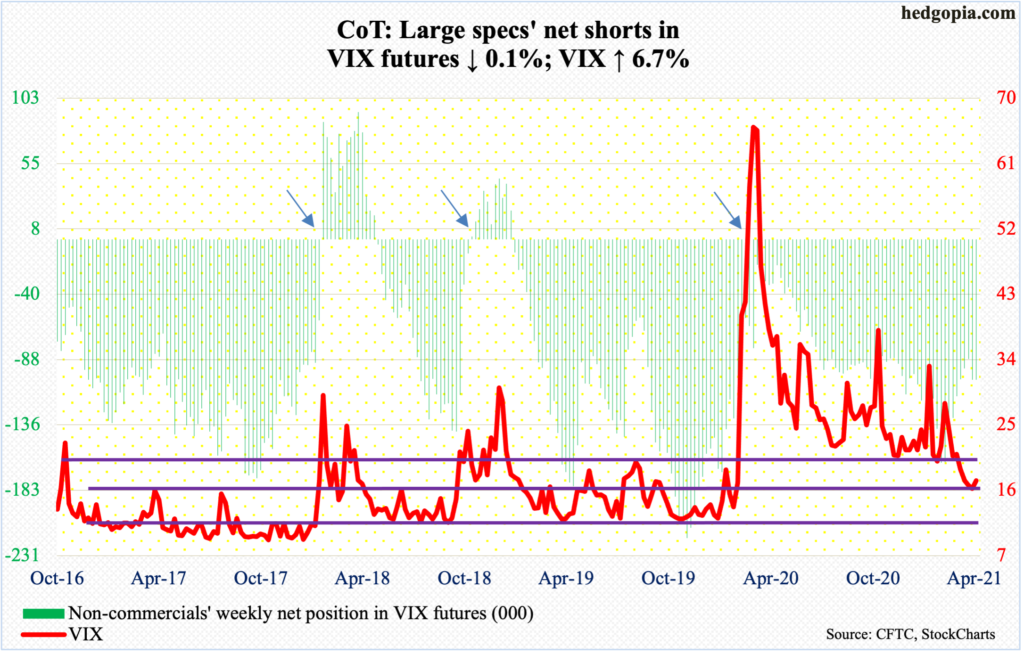
In late March, VIX (17.33) lost support at 20; by the 15th, it dropped as low as 15.38. The broken support-turned-resistance was tested twice this week – intraday highs of 19.70 on Tuesday and 19.90 on Thursday.
Shorter-term moving averages are turning up, but the daily seems to want to go lower for now. The daily lower Bollinger band lies at 15.45.


