
This Signal Points To More Upside In Stocks
NEW MONTHLY SIGNALS
The MSCI World Index tracks over one thousand large and mid-cap stocks in twenty-two developed countries, covering 85% of the market capitalization in those regions. As shown via the chart below, a positive monthly MACD cross was just nailed down on the chart of the MSCI World Index, which speaks to improving perceptions of future economic outcomes outside of the United States.
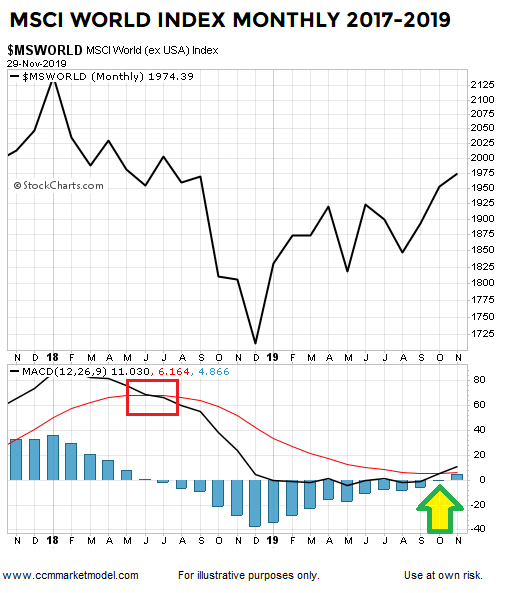
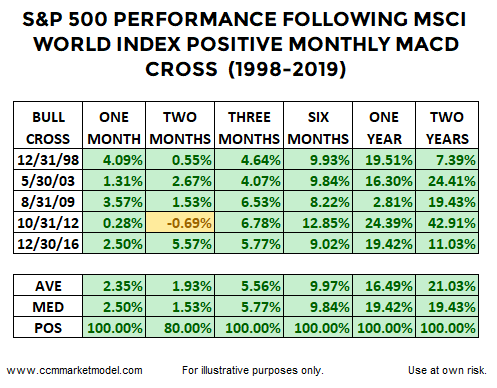
Since the inception of the MSCI World Index, there have been five similar monthly MACD crosses. Subsequent S&P 500 performance was favorable in every case looking out one month to two years. The median S&P 500 gain one year after the previous signals was 19.42%.
SIMILAR SIGNAL IN THE UNITED STATES
The opening segment of this week’s stock market video covers a similar bullish signal completed at the end of November on the monthly chart of the Dow Jones Industrial Average. Unlike the limited data set of the MSCI World Index, the Dow allows us to see how the stock market performed following similar monthly signals dating back to 1948.
THE WEIGHT OF THE EVIDENCE
The signals covered above align with the signals covered on November 17 and November 24, telling us to keep an open mind about better than expected outcomes in the months ahead, while maintaining a healthy respect for normal volatility.


