
The Value Of The Value Factor: Cheaper Now Than A Year Ago?
About a year and a half ago, after one of the worst relative drawdowns the value factor has ever seen, I wrote a piece showing the value factor was cheap relative to history. Since then, value strategies are on a solid run (look at pretty much any type of value strategy and I think you’d agree).
Today? The valuation spread between the cheapest 10% and the universe of stocks is cheaper. We are at levels beyond 1999 by some measures.
Same as the last time, in this piece we look at the “value” of value. And same as the last time, a few questions arise in this scenario:
- Where do we stand relative to history?
- Is this a tactical opportunity to shift into a value exposure?
Here are the conclusions:
- It depends. We are “unprecedented” on some measures, but only at the “this is getting interesting” stage on other value metrics.
- One thing is clear: the opportunity is better now in EBIT/TEV, specifically, than it was when I last wrote this type of piece from a relative standpoint. (though things can always get more extreme).
Will The Value Factor Party Like It’s 1999?
I was dreamin’ when I wrote this, so sue me if I go too fast
But life is just a party and parties weren’t meant to last
War is all around us, my mind says prepare to fight
So if I gotta die I’m gonna listen to my body tonightThe artist formerly known as Prince – 1999 https://youtu.be/rblt2EtFfC4
It’s important to make a distinction between relative and absolute in this case because that’s what makes this data so interesting. And we’re going to focus on our preferred value metric, EBIT/TEV.
For EBIT/TEV, even though stock prices have surged in an absolute sense (value or non-value alike) in the last year, the difference between the top 10% cheapest US stocks and the universe of US stocks is beyond 1999 levels (getting close for International stocks). And, yet, even with value stocks surging for the last year (and then some), the valuation spread is wider than it was back in April 2020.
Here’s the ratio of the median valuations for the top decile “cheap stock” portfolios by EBIT/TEV and the median valuations for the respective universes (e.g., US or EAFE countries):
(Click on image to enlarge)
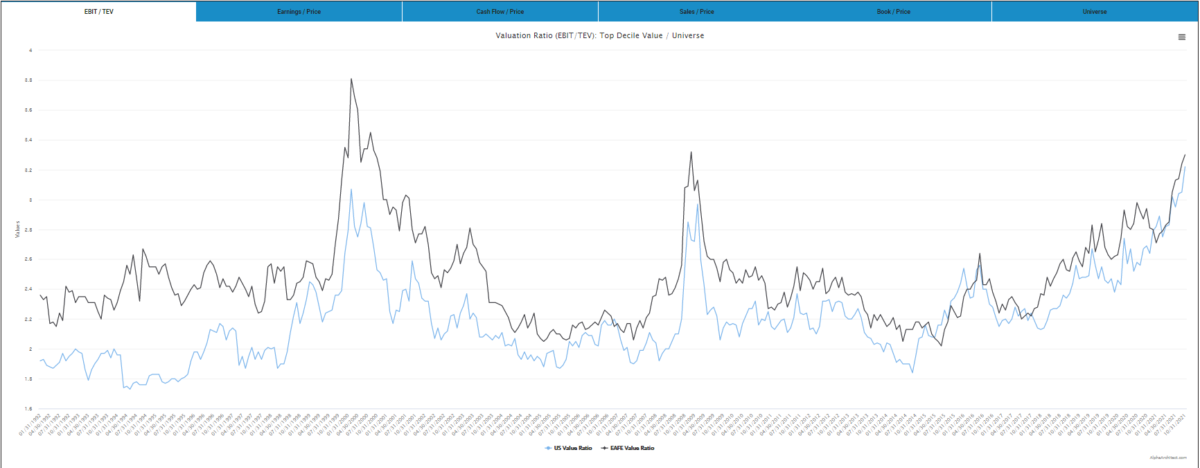
The results are hypothetical results and are NOT an indicator of future results and do NOT represent returns that any investor actually attained. Indexes are unmanaged and do not reflect management or trading fees, and one cannot invest directly in an index
Look at the blue line for the US value ratio. As of 10/30/2021, it is above February 2008, and even wider than it was in February 2000 (the previous highest point on the chart). We are certainly in extreme times by this measure.
OK – if we know we are in extreme times…what to do?
@Corry_Wang had a great thread on twitter looking back at the tech bubble for perspective. I encourage you to go read the whole thing. Here’s the first lesson he gave from it…”Everybody knew it was a bubble.”
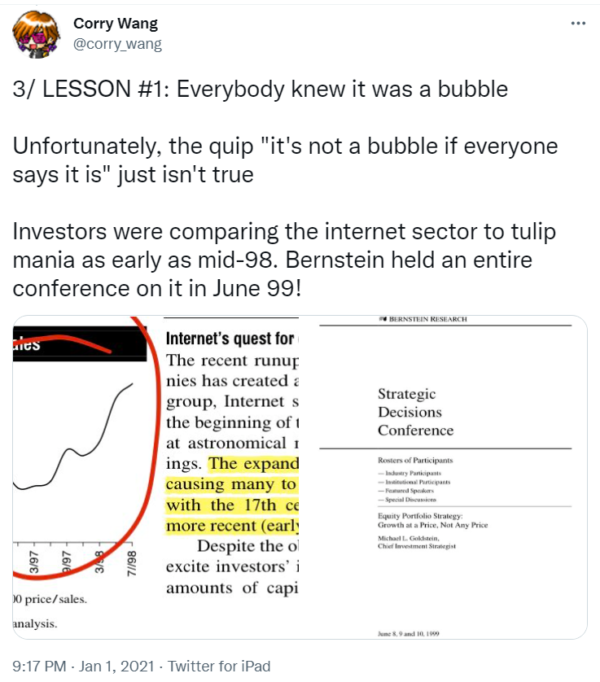
I’m not a huge fan of the word bubble because it implies the market is going to pop and everything is going to crash. There are plenty of ways this could end without a market-wide crash. But the point is the same then as it is now. We know we are in extreme times. The question is whether we ride the extreme valuations or if we move to more undervalued areas now (and potentially have to miss out on returns from it becoming even more extreme)?
Conclusion
Parties were not meant to last. Is this the end? It depends. Things can always get more extreme. Based on valuations, you could absolutely (and relatively) do worse on your timing to buy value stocks as either a diversifier for your portfolio or something more.
Appendix of all the valuation spreads:
Below I’ve included all the other valuation spreads we track in our visual factors tool, with light commentary.
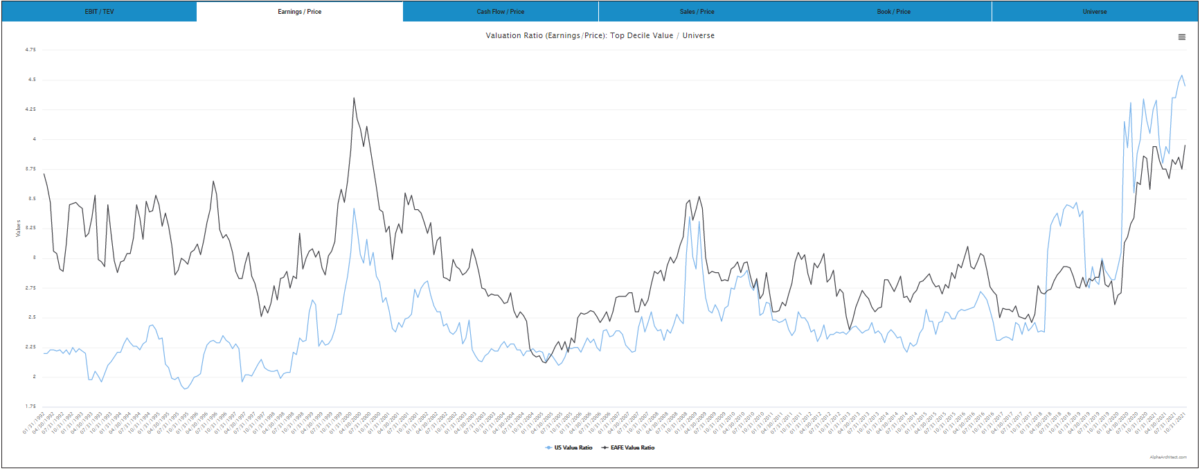
Earnings/Price:
Wider valuation spread than 1999 in the US.
(Click on image to enlarge)
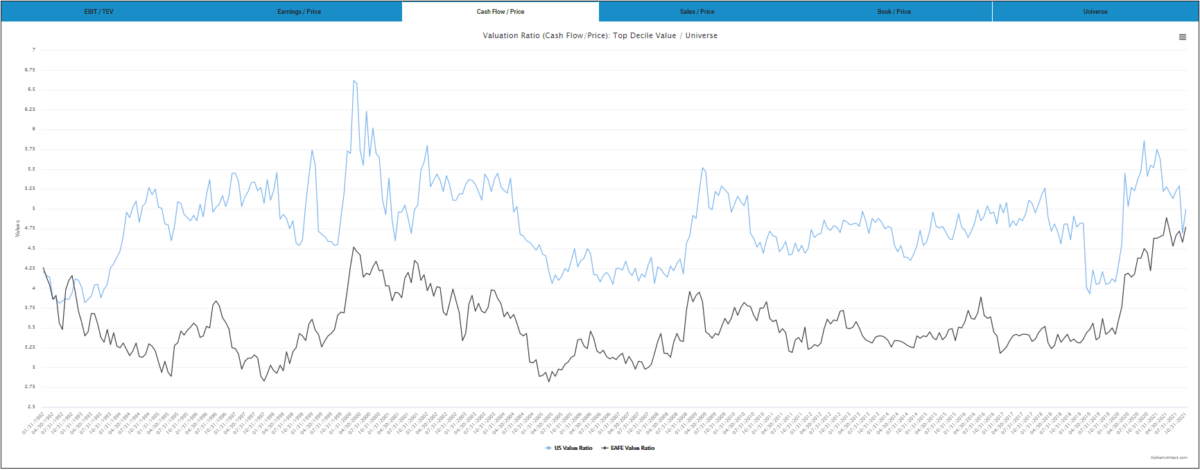
Cash Flow/Price
The international valuation spread is wider than the 2000 peak, but the US valuation spread is not as high relative to its history.
(Click on image to enlarge)
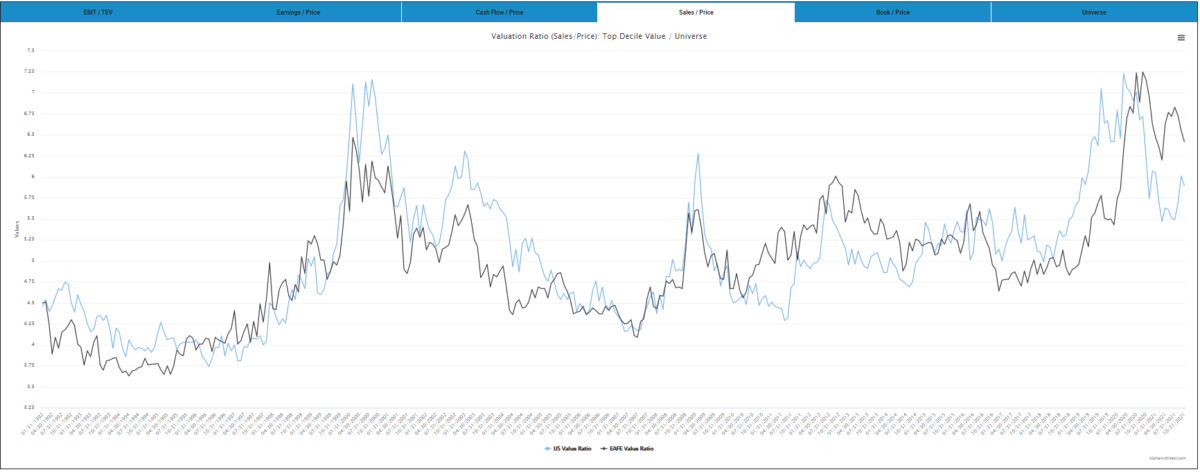
Sales/Price
Was momentarily wider recently in both US and internationally, but has come back down some.
(Click on image to enlarge)
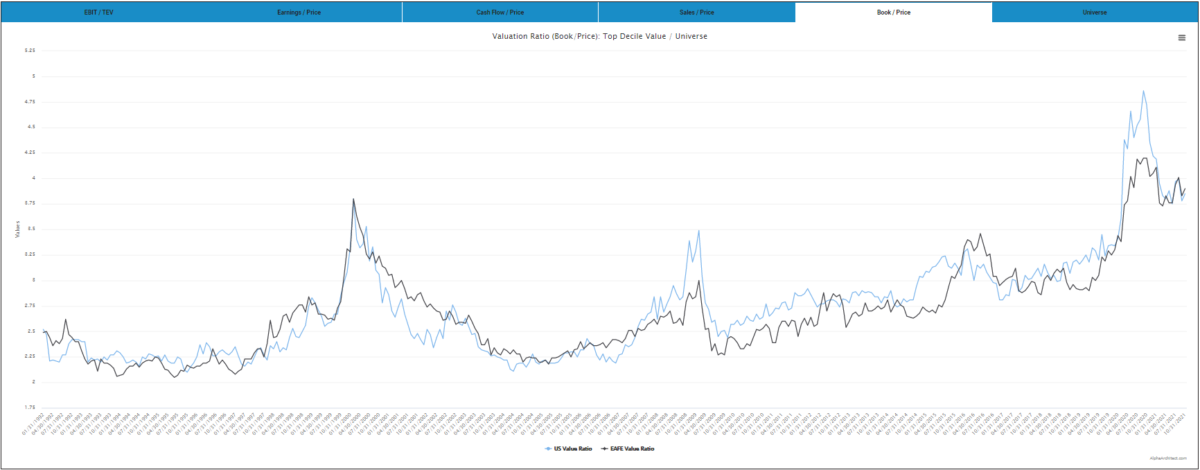
Book/Price
The Book/Price valuation spread is wider than the 2000 peak in the US and international (even after coming down some).
(Click on image to enlarge)
Disclaimer: Performance figures contained herein are hypothetical, unaudited and prepared by Alpha Architect, LLC; hypothetical results are intended for illustrative purposes only. Past ...
more

