
The Ultimate Guide To Candlestick Patterns
From an academic point of view, a stock market values companies based on the supply and demand for shares in the company.Investors will bid up (or down) the price of shares in the company based on the financial performance of the firm as shares change hands.
There is a third variable at play though.In the 1700’s a Japanese rice merchant by the name of Munehisa Homma detected a link between the supply and demand, the emotions of traders, and the price of rice.Beyond making Homma a wealthy man from trading rice, discovering this link lead to Homma becoming the father of candle stick charts.
What Is A Candle Stick?
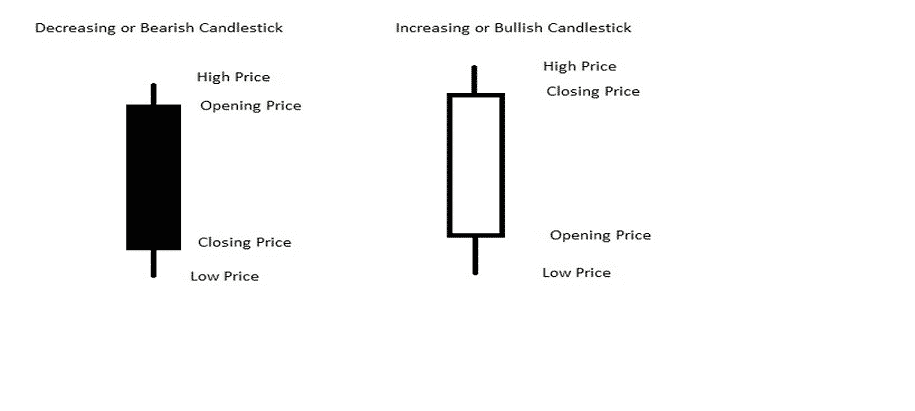
Simply put, a Candle Stick shows the relation between the high price, low price, opening price, and closing price of a stock over a set period.It gets the name from the shape of the arrangement.
The size of the Candlestick is based on the variance in price of the security.The larger the price variance of the security, the larger the Candlestick.Similarly, the wick (the difference between the high price and low price) can be longer or shorter based on the price variance over the time period.The wick can be longer than, or exactly the length of the body of the Candlestick, but not any shorter.To increase visual cues, the body of the candle is colour coded.An open that’s higher than the close (or decreasing candlestick) has the body of the candle filled in red or black.Conversely, a close that’s above the open (or increasing candlestick) has the body of the candle filled in green or left hollow.
How Does This Help Us Predict Investment Performance?
By looking for patterns in candlesticks, we can get a sense of future performance.There are simple patterns, and more complex ones.Let’s start with the simple patterns.
Simple Patterns
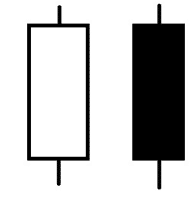
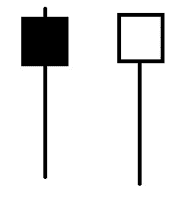
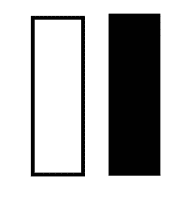
Big Black and Big White
A big black or big white candle has a long body, with small wicks.It means that there was a big difference between the open and closing prices, but the high and low prices for the day weren’t much over or under the opening and closing.A big black candle is considered a bearish signal.A big white candle is considered a bullish signal.
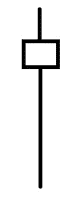
A doji occurs when the open and close are virtually identical.On it’s own, a doji is considered a neutral sign.The wicks on the candlestick can help reveal more information.

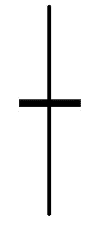
Dragonfly Doji
The opening and closing prices are at the highest of the day.A long lower wick (or shadow) is a bullish sign.It can signal a reversal and that the security is at the bottom of a trend.
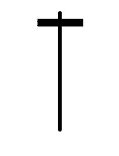
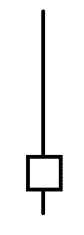
Gravestone Doji
Opening and closing prices are at the lowest of the day.A long upper wick is a bullish sign.It can signal a reversal and that the security is at the top of a trend.

Long Legged Doji
Long upper and lower wicks.It signals that there are strongly balanced opposing forces
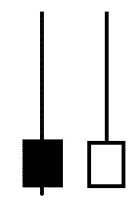
Hanging Man
A bearish reversal pattern.Typically found as a security is trending upwards.The lower wick is long with little to no upper wick.The lower wick must be twice as long as the body of the candle.
Hammer or Black Hammer
The same candle as the hanging man, only found as a security is trending downward.A bullish reversal pattern.A hammer with no upper wick is called a Shaven Head.
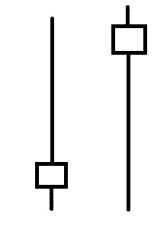
Inverted Hammer or Inverted Black Hammer
The reverse version of the hammer candlestick.A long upper wick, with little to no lower wick.The lower wick must be twice as long as the body of the candle.Found in a downtrend, it is usually taken to be a reversal pattern.Traders look at the open and close in the next period to validate the signal.An inverted hammer with no lower wick is called a Shaven Bottom.
Long Lower Shadow or Long Upper Shadow
A bullish (lower shadow) or bearish (upper shadow) where the longer wick is at least 2/3 of the total range of the day.
Marubozo
A candlestick with a long body and no wick.A white or green marubozo candlestick is bullish.A red or black marubozo candlestick is bearish.
Shooting Star
An inverted hammer, only found in an uptrend is commonly thought to signal a reversal.Traders look at the next day’s open and close to validate the signal.
These simple patterns can give us a hint as to where the investment is going, but just because something has gone up, doesn’t mean that it will continue going up.Conversely, an investment that is declining in value isn’t necessarily going to decline in perpetuity.Let’s look at some complex patterns to increase our predicting ability.
Complex Patterns
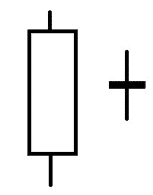
Bearish Harami or Bullish Harami or Harami Cross
A harami is a pattern of at least two periods with the first period being a candlestick with a long body running in the same direction as the trend.The next period is a doji.It signifies a reversal.
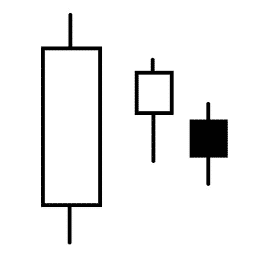
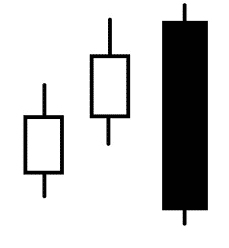
Three Method Formation
A continuation pattern that can happen when the security is rising or falling.The first candlestick has a long body.The next candlesticks in the sequence can be bullish or bearish, but must fit within the body of the first candlestick.
Dark Cloud Cover
A bearish reversal signal.A dark cloud cover pattern is found in an uptrend, when a large body black candle develops.It opens above the close of the previous white candle, but closes below the midpoint of it.It is confirmed when the next period continues the trend of falling prices.
Engulfing Line
It can be bullish or bearish.It occurs when the second period is opposite the trend, with a longer body.
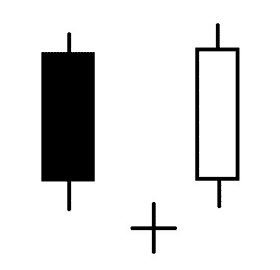
Evening Doji Star or Morning Doji Star
An evening doji star is a bearish reversal pattern.A white body candle in an uptrend, followed by a doji above the close, followed by a black body candle with the open below the doji.
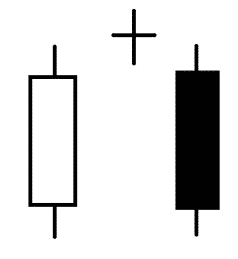
Conversely, the morning doji star is a bullish reversal pattern.A black body candle in an downtrend, followed by a doji below the close, followed by a white body candly with the open above the doji.
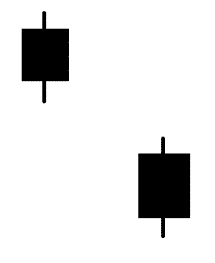
Rising Window or Falling Window
A rising window has a white body candle, followed by a white body candle with a low higher than the previous high.
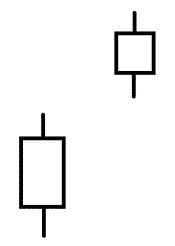
Conversely, the falling window has a black body candle, followed by a black body candle with a high lower than the previous low.
On Neck Line
After a downtrend, a black candle, followed by a white candle.The closing prices of the first are near to the closing prices of the second.

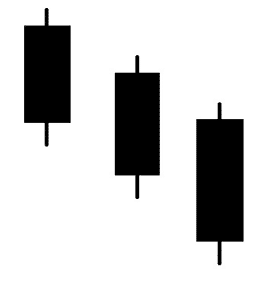
Three Black Crowns
A bearish pattern that indicates the reversal of an uptrend.Three consecutive black candlesticks that open within the body of the previous candle, and close lower than the body of the previous candle.
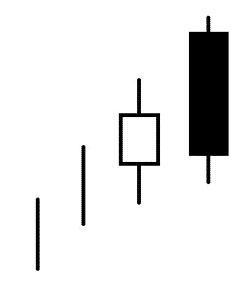
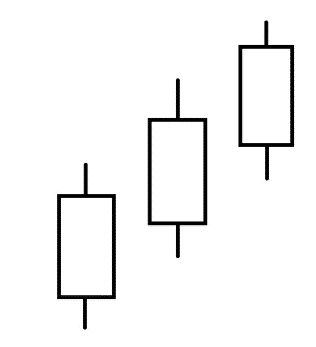
Three White Soldiers
The opposite of three black crowns, this pattern indicates the reversal of a downtrend.Three consecutive white candlesticks that open within the body of the previous candle, and close above the body of the previous candle.
Piercing Line
This pattern is found over two days and is a possible reversal of a bearish trend.It has short term predictability, but isn’t accurate beyond that.A black candle, followed by a lower open than the black candle’s close (called a gap).The close of the second day is above the midpoint of the first day’s candle body.

The above signals are not infallible, but do give an investor a sense of where buying and selling momentum is taking an investment.
Disclaimer: The information above is for educational purposes only and should not be treated as investment advice. The strategy presented would not be suitable for investors who are ...
more

