
The Stock Market May Have Already Topped Out

Nasdaq 100 (QQQ)
Stocks were smashed on March 3, with the Nasdaq QQQ down 1.6% for the week, giving back all of Monday’s big gains. Worse is that the ETF closed below support at $310, which probably means we have more to fall. The next level doesn’t come until $305; after that, $298.The ETF could easily fall back to $274; it sounds crazy, but there is a giant gap there, and it needs to be filled.
(Click on image to enlarge)

The Nasdaq 100 also finished today below the March uptrend. This could be a significant change in trend. The RSI hasn’t come close to bottoming; it needs to get below 30.
(Click on image to enlarge)

S&P 500 (SPX)
The S&P 500 wasn’t any better, falling by 1.3% and closing at 3,819, giving back almost all of Monday’s gain. We did manage to also close on the lows of the day and continue to put in lower tops in the index. It is also notable because we closed for a second time below the November uptrend. That means the next uptrend is from the March lows. The only good news is that the RSI hasn’t made a new low; it is still hanging on.
(Click on image to enlarge)

US 10-Year
The 10-year is very close to taking another significant move higher, with the potential to push up 1.65%, should it break above 1.5%.
(Click on image to enlarge)

The 10-year minus 2-year spread is approaching 1.4%. That is a big level of resistance. An increase above 1.4% sets up a big climb to around 1.8%.
(Click on image to enlarge)
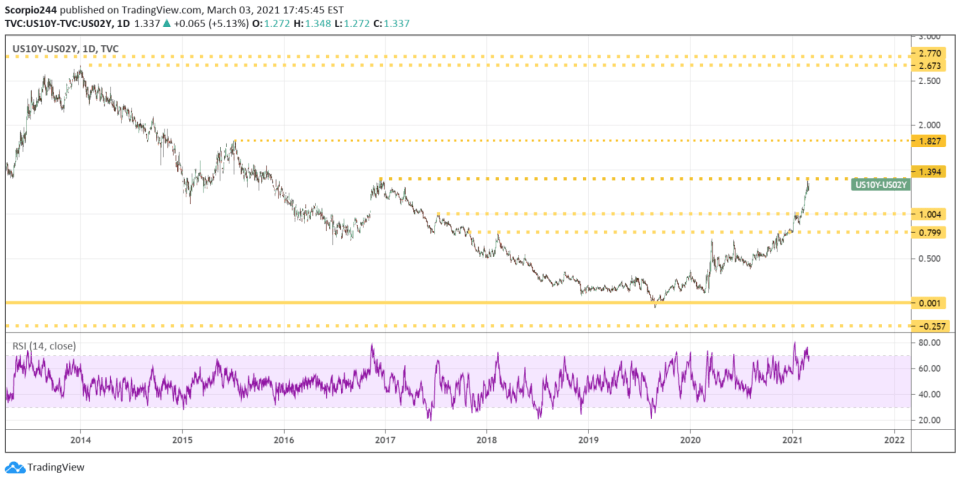
Why do we care about the 10-year/2-year spread? It has been a pretty good indicator of S&P 500 tops in past years, yes peaks, like the 2000 and 2008 kind. There was also a pretty quick decline of around 20% in the early 1990s. If this were a peak in the market before a long and protracted decline, it would make sense from a historical perspective.
The chart shows rather clearly that the market tends to peak around the time the spread bottoms. The decline in the S&P 500 has happened as the spread has started to widen. It means that when 10-year rates start to rise, it kills the bull market, but again, these are big moves in the 10-year, like 200 to 300 bps. The kind of move we are now in the middle of witnessing.
Based on this chart, the S&P 500 should have already peaked, and it very well may have. If that is the case, then we could be looking at a massive drawn-out drop. Not fast and sharp like March 2020, but something more like 2000 or 2008.
(Click on image to enlarge)

Amazon (AMZN)
Amazon fell today below some key support at 3,000, and that will put 2,870 back on the table. The RSI has broken lower too, and it is not yet oversold, at 34.
(Click on image to enlarge)

Roku (ROKU)
Roku broke support today at $385, not a shocker. The stock isn’t done falling either. It likely heads towards $310, and then probably lower than that.
(Click on image to enlarge)

Costco (COST)
Costco is so close to filling that gap at 317.50. The stock is getting oversold now, but that doesn’t mean it’s a bottom.
(Click on image to enlarge)

Shopify (SHOP)
Shopify fell through support at $1280 today, with the next big level to watch for coming at $1105.
(Click on image to enlarge)

Disclosure: Mott Capital Management, LLC is a registered investment adviser. Information ...
more


I have figured that the way to make a good profit buying and selling stocks is to buy before the price rises, and then sell at the higher price just before there are no longer any buyers. That is because, i have deduced, there must be somebody to buy in order for a sale to happen. Sort of like physics, "for every action there is an equal and opposite reaction." We can say that "for every sale there must be a buyer"
Thus the wisdom that works is knowing that moment just before there are no longer buyers willing to pay the price.