
The Performance Evaluation Report Card (PERC) Methodology Explained
As a further follow-up on yesterday’s TalkMarkets’ article, I want to make it clear from an analytical perspective that I have always viewed Globanomics to be a simple, yet complex, math science. The origins of the math side of globanomics came from work that I did while serving as the Risk Guy on Ginnie Mae's mortgage-backed security portfolio. I started this job in 1989 just as the Savings & Loans debacle was starting to show its ugly head. I was about five-years out of Wharton, going nowhere very fast--I was yet even a manager at one of the Big Four accounting firms.
I had built an analytical system earlier for the Post Office using some simple math and making the use of the statistical package, SAS. SAS was the key for me, an analytical type. Hell, with SAS we could look at 7 million loans, run sophisticated statistical analysis, in less than a minute. This was a dream job for an analytical person like me. In the job I hired only young people into my group--looking for business types, analytical in nature, and some level of computer savvy. In total, we had about fifteen people in all working on "risk analysis".
Anyway, one of the first things I did was to try and analyze the loan portfolios of at the time about 800 mortgage loan portfolios. We would run our statistics, download them, and throw them into a micro base, (DBase II at the time). There is a good article in Mortgage Banking, written back around 1990, that talks about what we did.
In this job around the 1994 timeframe I was recognized for my work and issued a Vice-Presidential Award Hammer Award, issued to me by the Treasury Secretary, at a ceremony held over at the Treasury Building.
Key to receiving the award, was the development of our analytical system which analyzed each mortgage loan portfolio. We called it IPADS at the time (i.e., Issuer Portfolio Analysis Database System).
Now what I would like to share with you is what one of my cohorts and I called The Performance Evaluation Report Card (PERC) methodology. It is PERC, which I would use to evaluate countries, using the scaling system I have mentioned in other articles (i.e., 25% Primary Essentials; 25% Secondary Essentials; 35% Primary Growth Factors; 10% Secondary Growth Factors; and 5% Creative Development.
I want to add a couple of things in here relating to PERC before I send you to the PERC material that I believe you should see. Tristan Yates worked for me and was primarily responsible for building the so-called Expert system that we built at Ginnie Mae. Tristan did not have a college education, but I hired him because I knew he was smart, and he sounded like the kind of computer savvy kid I would like to have around me. Later in life, I had left DC in 2000, and returned home in essentially semi-retirement. Around 2004 I saw that Wharton was putting on an Innovation Tournament, so I called Tristan and asked him to help me put together this thing we ended up calling PERC.
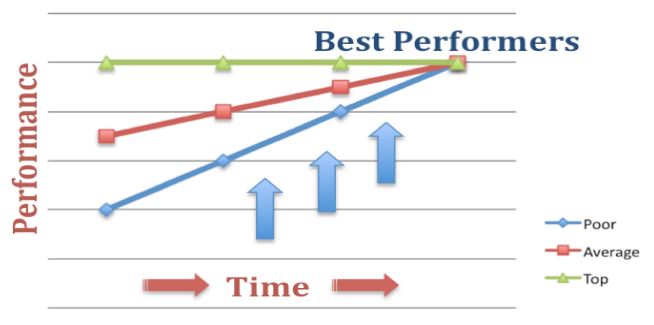
Now the second thing I would like you to keep in mind when you look at PERC. Key to PERC is the graph which shows the poor performers moving closer and closer to the best performer. Now this is a subtle point because in a way the graph is right--poor performers should move closer to the best performers over time, but the one thing that the graph does not show, is any growth from the best performer. And when you think of it from that point, then this is where you start getting into "positive growth" and "exponentiality."
Now what follows is our PERC methodology as we explained it with Wharton's Innovation Tournament.
PERC
(Performance Evaluation Report Card)
A Wipro – Knowledge@Wharton Innovation Tournament Submission
Introduction--What is PERC?
PERC is an operational improvement methodology that uses commonly accepted performance metrics and market competition to drive process improvements and to jump start innovation throughout all levels of an organization simultaneously. PERC can be applied to individuals, teams, business units, companies, towns, cities, countries, or any other organizational form, as long as there is a common degree of similarity between comparative units. PERC relies upon simple, yet precise and relevant analytics, open communication, trust, and executive management interest and support.
The fundamental objective behind PERC is to improve business performance, not in just one portion of an organization, but throughout the entire business organization or industry, using a report card mechanism or feedback loop that is regularly updated and monitored. A conceptual view of how one might view PERC being employed over time is seen in the following Exhibit.
EXHIBIT 1
Identifying and resolving performance differences in the poor performers drives the entire population towards the best performers, improving the averages.
PERC is distinct from other analytical performance methodologies such as Six Sigma or Process Reengineering that focus on just one specific process or output and/or attempt to replicate one single “best practice” among dozens of similar entities. Although process improvement is one inevitable outcome of PERC, it is driven not by top-down decision making that may or may not be applicable across a wide range of participants, but by the efforts of individuals directly involved in and responsible for their own output.
The basic theory behind PERC relies on the following two principals: (1) “Effective” performance operations can be analytically distinguished from “less effective” performance operations using reliable methods of unbiased statistical analysis that is acceptable to all and which can be regularly updated and monitored over time; and (2) everyone within an organization prefers playing for a “winning team” rather than a “losing team”.
Just like Quality Assurance, PERC is free or a profit center if applied correctly. Proven in practice, PERC has a wide applicability and deserves to be a standard management practice for process improvements.
Individuals Behind PERC
PERC is the submission of Jim Boswell (Wharton WG ‘83) and Tristan Yates (INSEAD IG ‘03). PERC developed its roots in Washington, DC in 1990 during the U.S. Savings & Loan crisis, in which bad lending by US Savings & Loans resulted in the failures of more than 700 financial institutions resulting in an ultimate cost to the US taxpayer of $124.6B.
Boswell, a manager at Coopers & Lybrand at the time, was tasked with analyzing, managing, and mitigating the public risk for the Government National Mortgage Association (Ginnie Mae) MBS program during the crisis. Given the magnitude of the potential crisis and the constraints faced by the government at the time, Boswell developed a methodology that would help not only identify troubled issuers, but also improve the performance of all issuers, helping to reduce the overall risk and prevent future institutional failures.
To implement this program, he hired a team of analysts. At 19, Yates was the youngest associate on the team and benefitted significantly in his career by the early exposure to PERC, using it just a few years later to help drive network performance and service improvements at UUNET Technologies, the first commercial Internet service provider. Since those earlier years, both individuals have continued to refine and develop the concept behind PERC.
How PERC Works
PERC can be viewed as having three phases in its application: (1) an Endorsement & Evaluation Phase; (2) an Analytical & Scoring Phase; and (3) a Feedback & Learning Phase. Each is discussed below in turn.
The Endorsement and Evaluation Phase
The objective behind PERC is to improve performance throughout an organization, using both internal and external organizational indicators in a feedback loop that provides a way to monitor progress towards goals over time. In the Endorsement and Planning Phase of PERC an organization must decide what it is that one wants to do or become and then how best to establish a monitoring system that supports or facilitates movement towards those organization goals and aspirations.
From the outset, a program implementing PERC should have explicit executive endorsement. This can be challenging if executive management has not seen a PERC methodology in practice before and cannot understand the process or benefits which, at the outset, are entirely conceptual. In theory, however, data-driven analysis can always generate new insights and these insights can be used to help sell the program.
Although lower level management may find it tempting to initiate PERC without executive endorsement, unfortunately in practice, without higher level endorsement, it makes it more difficult to develop performance indicators that are accepted by all without encountering resistance throughout the organization. As a result, one of the most important and critical elements of PERC, feedback and improvement, is compromised at best or simply just will not happen at all
Assuming executive-level endorsement, the next step in this phase (with the help or participation of a team of working unit managers preferred) is to develop an understanding of the quantitative characteristics, also called variables, indicators, or factors, that can be used to identify the best and worst performing units in a population. A typical analytical approach in this phase is to segment working units into appropriate comparative peer groups and then perform statistical analysis using available variables to determine which factors are likely to be useful as performance level indicators.
Generally ratios or weighted averages will be used in order to measure consistently across different output volumes. Even so, it is still critical to maintain valid peer groups, otherwise the results will be dominated by biases, correlations, and outliers, and the statistical distributions may become meaningless. For example, it does not make sense to compare the loan performance of banks with thousands of loans versus those that have millions of loans--not just because internal operations might be different, but the variances between expected norms are likely to be as well.
Although initial analysis assumes data availability and quality, there may be gaps that need to be addressed. Simple technical fixes can become huge obstacles when organizational boundaries have to be overcome--for example, not everyone has an incentive to deliver or share their highest quality data. Again, this is one place where executive endorsement can play an important role.
The end result of this phase of PERC will be the identification of several factors that have the potential to measure performance and predict positive or negative outcomes. While a few of these factors may be “inherited” and some might argue beyond a specific organization’s control, most should in fact be indicative of, or the direct result of, unit effectiveness and work performance.
Examples of Analytical Issues with Performance Indicators
Jim Boswell, (while working with Ginnie Mae)
Every MBS loan portfolio monitored by Ginnie Mae has a market value, and when that market value falls below zero, a mortgage bank (or issuer) has an incentive to default and deliver its portfolio to Ginnie Mae HUD and by proxy, the US taxpayer. Because Ginnie Mae was not yet collecting quarterly balance sheet and income data as the Savings & Loan crisis began, something else had to be done quickly—issuers had already started defaulting.
Using monthly accounting information reported on pooled securities, Jim quickly showed that high loan delinquency rates, when compared across peer groups, was a better leading indicator of whether an issuer would default than even the financial data was. At first, Ginnie Mae was skeptical, but quickly became convinced when other issuers that had been identified as troubled began defaulting, too. This inevitably led to the development of an “expert” scoring system (the next phase of PERC to be discussed).
Tristan Yates, (while working at UUNET):
Early in the company’s life, UUNET secured large contracts to build out the online networks that would later become America Online and the Microsoft Network, two of the largest internet networks in the world. Network data was widely available, and Yates, as a side project to his primary job, created reports using PERC-type logic for management showing gaps in network and service quality across several cities. But without executive endorsement, the managers responsible for the build out issues questioned the indicators, the data quality, and the usefulness of the reports. History later showed that the quality problems did exist, but without proactive effort, the costs to correct them were very high.
Later, these lessons were incorporated into a future project to address the accelerating growth of support costs. Yates received an explicit endorsement from the Vice President of Technical Support, and worked with individual managers to identify metrics relevant to their business areas. Workflow adjustments were made to improve quality and consistency of data, and, with the goal and process clear and the incentives aligned, managers embraced the new sources of information and used it to improve the performance of their individual units.
The Analytical and Scoring Phase
Once potential performance indicators are identified, during the next phase of PERC, it is time to develop a performance rating system for the different peer groups or organizational units that need to be monitored. Let’s follow how the factors identified above can be combined into a single score that expresses performance.
Starting out, each performance indicator has its own average, standard deviation, minimum, and maximum for its peer group of organizational units and every organizational unit has a raw value relating to each particular analytical performance indicator. The raw values need to be converted into a scale score. There are many ways to do that. One example, using statistical variances, is explained here. For example, if the average of an indicator is 40, and the standard deviation is 5, then a raw score of 50 (2 standard deviations away from the mean) for a unit might be given a scaled score of 10, whereas any unit score under 30 may be given a 0 (zero) scaled score. Then depending upon one’s desire or objective, organizational unit raw scores between 30 and 50 can be scored using a linear, standard deviation, or other logical approach.
Because multiple factors are used to evaluate performance, multiple scaled scores will be calculated. These are then averaged into a single score using a logical weighting scheme. For example, 20% could be based upon one factor, 30% on another, etc, totaling to 100%.
Creating this pre-defined weighting can be a computational challenge similar to fitting a regression model, but with a critical difference in that the goal is to incorporate as many useful factors as possible. A system with ten different factors, each sourced and/or calculated somewhat differently, but every single one having some explanatory effect on performance, is far more useful and robust than a system with only one or two indicators. History has shown that poor performers tend to score poorly in most performance indicator categories, and because of this, high score correlation is a positive outcome meaning that several factors are relevant to performance.
This relatively simple scoring system may not satisfy some mathematicians or financial analysts, but that is not the target audience. Managers and executives that would resist and/or distrust a complex formula can readily understand an average and how far they are above or below it. At its core, the scoring system is a communication tool—a report card. It is for operational use, not bookkeeping purposes.
Even so, whatever scoring system is derived, it is critical that the system is viewed as sufficiently predictive. This can be proven by using past historical data and recalculating performance rating scores for prior months or years for members of different peer groups. Then, as both the scores and historical outcomes are known, it should be easy to determine whether the system is functioning correctly - if not, weightings may have to be adjusted or some additional factors developed and/or perhaps some indicators dropped altogether.
During the life of the project (and part of the next PERC phase to be discussed), it is common for performance rating systems to be updated based upon newly available data or simply better information. When this happens it is useful to provide both the old and new rating system for a period of time to facilitate comparison and transition.
Example: (From Jim Boswell on the Ginnie Mae project)
As the scoring system was being designed, there was a discussion about whether the output should be letter grades, percentiles, deciles, quartiles, or some other indicator. In practice, it mattered little. A single numeric score from 0 to 10 was selected, calculated to two decimal places.
Far more important to the success of the project was the score’s presentation, explanation, and consistency. The reports received by individual managers contained not just the score, but also individual components, indicators, and trendlines in both graphical and tabular formats, as well as discussion about the process used and the high level goals of the project.
The Feedback and Learning Phase
The final phase to PERC is to make the results of the performance rating system visible to a wide audience that includes executive management, any appropriate team of analysts, and the individual managers responsible for the performance of the units being rated. The last audience (unit managers) is the most important, as it is ultimately their efforts that will drive change across the broader population.
As managers are provided with their performance ratings (or report card) with a detailed explanation as to how their scores are generated using population norms and standards, some level of confusion or consternation may likely generate. Managers with units rated poorly will almost certainly question the scoring system and its individual factors, their own ability to affect change, and/or possibly the entire PERC process itself. This is another point where executive sponsorship and prior management involvement or knowledge is critical.
It should be made clear that the goal of the analytical team is not perfect precision, but rather a fair evaluation. Data quality is never perfect and volumes are never ideal, but for most organizations in today’s world this should not be a particular problem. Since negative performance scores are not based upon single variables but collections of factors and a unit’s evaluation is based upon peer group comparisons, it is difficult to argue against the report card (especially if prior evidence shows the relationship of problems with the indicators used).
Of course, any potential data issues should be investigated and the system improved if necessary, but at this point the focus is not on the analysts, but the manager. How can performance be improved? What are others doing differently? What specific conditions exist? What obstacles can be removed? What processes can be streamlined? What problems can be resolved?
Initially PERC and its performance ratings might focus executive management’s attention on the poor performers in the population. This is where future problems are most likely to occur and where improvements can be made most rapidly, and thus the best use of scarce time and resources. However, top performing units also represent opportunities to showcase individual management efforts and spread information throughout the organization on what “best practices” actually are working and other units may want to try.
Performance ratings should be provided at scheduled intervals (e.g., monthly, quarterly), depending upon cost effectiveness and reporting issues. This carries with it another opportunity, allowing executive management and the analytical team to view performance trend lines, not just for individual managers, but for the population as a whole. If poor performers are improving their operations over time, then this will raise the averages for the entire peer group.
This means that an organization which rated just above average a few months (or other reporting cycle) ago, but made no additional improvements, could very likely find itself moving down in the rankings. If such a unit wants to arrest this decline, then they, too, will have to improve their operations. Thus indirectly the performance of the average peer group is also improved, and their better scores force the top performers to work harder to maintain their advantage.
Example: (From Jim Boswell on the Ginnie Mae project)
The initial data used to develop the scoring system was based on securities accounting data from issuers, a set that included information on dollar amounts and loan delinquency, but only at a high level. Later in the project, a new source of data became available, at the individual loan level.
Loan level data contained information such as where and when the loan was made and the interest rate, all of which are be indicators of whether a loan is likely to be or become delinquent or go to foreclosure. By combining the specific portfolio distribution of an issuer with higher-level averages from across the program, customized portfolio averages were created that helped to further distinguish economic from institutional performance.
Comparison of PERC with Other Improvement Methodologies
PERC is very different from methodologies like Six Sigma and Business Process Engineering, and it is important to communicate these differences to executives and managers, especially those who have been involved in, and perhaps disappointed by, the results of other methodologies.
PERC uses business metrics to analyze operations and provide regular, consistent, and clear feedback to individual managers who have both the authority and the responsibility to improve their operations and now the attention of executive management to help facilitate any necessary higher level changes.
In contrast, methodologies like Six Sigma and Business Process Re-engineering that impose new work processes and structures from the top down can leave individual managers less accountable and often disengaged from the process. Because they are not experts in these methodologies, they are asked, at least initially, to turn over vital parts of their operation to an outside team of experts or consultants.
Implementing a full process reengineering across a large business unit can take months, during which two processes may be performing in parallel. Only at the end of the project can the results be seen and evaluated. PERC, in contrast, captures any improvement as it is occurring, incentivizing managers to focus on the simplest changes that will have the greatest immediate impact, better allocating their scarce resources.
And while Six Sigma and PERC may share similar goals, the improvement of business processes, the issue is that Six Sigma, by itself, provides no insight into which processes to focus on or how much effort is to be expended in refining them. While consultants are often tempted to simplify and abstract operations, business realities are much more complex and dozens or hundreds of work steps are typical. Turning every single one into a nearly error-free process isn’t realistic in any reasonable time frame.
PERC can co-exist with any other process improvement methodology, and in fact, can provide a means to evaluate their performance. If one organization uses a Six Sigma approach, assuming that refinements in their processes will lead to better output, then PERC can test that assumption and deliver an ongoing evaluation. PERC is results-driven rather than tied to any specific management approach and thereby encourages solution-oriented efforts.
Current PERC Application—2008-9 Bank Analysis
It’s clear there is no greater challenge to the economy than the working through this financial crisis and presenting future ones. To show the relevance and utility of PERC, we decided to identify which of the more than 8,300 banks in the US performed well over the past fifteen years and which ones have not. Our data source for this evaluation was not from any private data work files, but from publically provided information available on the internet regarding the quarterly financials provided to the Federal Deposit Insurance Corporation (FDIC).
To show PERC’s predicting capability, we have attached to our innovation submission an Excel Spreadsheet (Quanta Analytics List of Trouble Banks) which displays the list of banks that we believe are currently in jeopardy of being taken over or shut down by the FDIC. The attached list was compiled in less than one day (August 28, 2009--one day after the most recent June 2009 FDIC-submitted data became available to the public) using simple ratios and standard business indicators and PERC analysis.
Since making this list available to colleagues more than two months ago, twenty-three out of the first twenty-five banks that the FDIC has shut down since August 28 were on our list—a list that represents less than 3.5% of the more than 8,300 FDIC-monitored banks, and a list that is less than two-thirds the size of the FDIC’s own publically stated, but not publically shared, list of banks in trouble. Institutions are sorted by those most in jeopardy.
Aside from being able to predict failures, PERC can prevent them. Our goal is that this methodology becomes a standard part of managing the global financial sector and preventing these types of crises in the future. Of course, this requires executive sponsorship in order to be effective.
In Summary
PERC is a methodology designed to facilitate rapid and ongoing performance improvements across peer groups. It can be applied to any populations that have measurable processes and outputs and in which distinctions can be drawn between the best and worst performers and some historical data is available.
PERC, via a performance rating system, provides clear, consistent, and frequent feedback. For the poor performers in a population, this is a challenge to improve and to bring their scores closer to the average. At this point they have responsibility, accountability, and the benefits and pressures associated with executive management’s attention. This is an environment in which operational issues can be identified, prioritized, and addressed.
Over time, positive efforts by these organizations will yield results, thereby raising the average indicator scores for the peer group and improving performance for the population as a whole. Rising averages provide pressure to all organizations in the peer group to maintain their rate of improvements or risk declining in the rankings.
PERC is performance oriented and does not try to reengineer existing business processes, but instead challenges managers to make good decisions as to where efforts should be allocated. It also relies upon a natural preference for individuals to be evaluated with clear feedback and rewarded quickly and fairly for their efforts large and small.
A PERC program can be put in place in response to a crisis to drive rapid improvements, but can be also run for years or decades in order to prevent future problems. It is a powerful system with a light touch, as the monthly reports become part of the regular feedback received by all managers on their efforts and an opportunity for executives to identify and arrest potential problems when small and manageable.
Given its capabilities and wide applicability, PERC is an important tool for executives and managers in both public and private organizations that can be carried from project to project. As such, it merits a place in the education of every manager, analyst, and executive.
PERC is also uniquely suited to address the challenges of the current financial crisis, having done so once before in the aftermath of the Savings & Loan crisis. It provides a mechanism for monitoring and improving a large population of organizations by using transparent and relevant indicators, and it can be implemented rapidly. An effectively implemented PERC program would have the potential to reduce both the likelihood and severity of future financial crisis.
Disclosure: No positions.


Haven't heard the phrase "Globanomics" before. Did you coin that?