
The Panic Playbook: A Blueprint For Market Crises
For investors of all shapes and sizes, the question of the day appears to be, now what? After the 14% thrashing of the Dow Jones Industrial Average in just seven sessions, one can't be blamed for feeling a little shell shocked. In short, these types of market panics can leave one disoriented and unsure about what to do next.
Two weeks ago, folks were complaining about the lack of any market "dips" to buy into. The underinvested felt left behind and anxious about whether there would be an opportunity to put money to work in the stock market. Such feelings are typical after the type of relentless run seen from October 1, 2019, through February 19, 2020.
As we have discussed in previous missives, it is important to remember that the market had become overbought and over-believed and the charts of many leaders such as Microsoft (MSFT), Visa (V), and Apple (AAPL) had gone parabolic. As such, stocks were due for a pullback, a pause, or a period of what I like to call sloppy action. The key point here is that some sort of dance to the downside was to be expected.
Although many analysts, including yours truly, were on record calling for a pullback of some form, almost no one suggested that stocks would plunge from all-time highs into "correction territory" (meaning 10% off the highs) in record-breaking fashion. And according to CNBC, this is exactly what happened as the panic selling pushed the Dow from an all-time high to the 10% correction mark in the shortest period ever.
I know of no one that suggested the market would enter a waterfall decline driven by fear and the uncertainty of what COVID-19 will do to global economies. But unfortunately, a scary, emotional, "bad news panic" is exactly what we've got on our hands right now as traders and their computers are clearly in "sell first and ask questions later" mode.
The Problem is Obvious
The current market worry is in plain view. Investors fret the slowdown caused by the virus will push the economies of the world into recession. And "the message" from the bond market appears to concur as the yield on the U.S. 10-year closed Friday at 1.127%, the lowest level in history, and this morning is trading at 1.085%.
But it is important to recognize that from a historical perspective, this scare is likely to be temporary. We can look at both the 2003 SARS and 2009 Swine Flu epidemics as a guide. But since the primary concern is economic (from the market’s perspective), we can also look at how markets reacted to the 9/11 terrorist attacks and the 2011 Japanese Tsunami.
The bottom line is past events proved to be temporary and markets rebounded in fairly short order. Whether the COVID-19 scenario will play out in the same fashion remains to be seen.
Remember: Corrections Are Part of the Game
We can also look at the situation more broadly as there can be no denying that stocks are in correction mode. As such, it may be helpful to take a look at how past corrections have played out. So, according to CNBC, there have been 26 corrections since the end of World War II. The average decline for the S&P 500 during the prior corrections has been -13.7% and the current decline is -12.76% as of Friday's close.
Next, this study shows that the corrections lasted about four months on average and took about four months to recover.
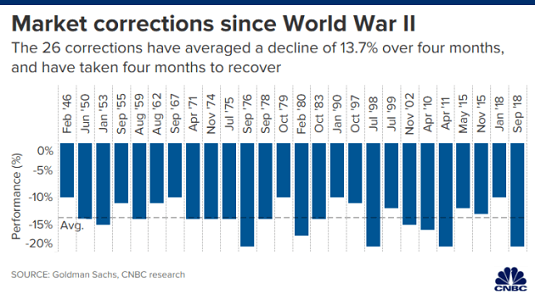
Image Source: CNBC
We've Seen This Movie Before: The Panic Playbook
To be sure, we can't know the economic impact of folks staying home and canceling travel plans in an effort to stay healthy and avoid this virus. Yet, I think it's important to also realize that we are not in uncharted territory here. As I wrote last week, we've seen this movie before. And in the end, the hero doesn't die.
Experienced investors know that "bad news panics" that result in waterfall declines tend to follow a familiar pattern. First, you see panic selling based on the "bad news." And a plunge of 14% in seven days on the Dow certainly qualifies here.
Next, we see an "emotional low" where fear is pervasive and stocks "flush" to the downside in dramatic fashion. In the days before computers dominated trading, this was fairly easy to spot. Investors panicked out of their positions and assumed that the sky was actually falling. However, the high-speed trading era has made "emotional lows" harder to identify as trend-following algos tend to "chase their tails" until the closing bell rings and moves of 2% in a matter of minutes are now commonplace. Thus, I think the jury is still out on whether Friday's third 1,000+ point dive in a week was a panic low. My personal guess is no. But we'll see.
After the emotional selling phase happens (As in, "get me out at any price!"), a "dead cat bounce" usually occurs. These moves are usually violent to the upside as traders cover shorts, undo hedges, and put on some long exposure - all at the same time.
One of the lessons I've learned in my career is that unless you are dealing with a news-driven event that can be "solved" with a headline, it is best to avoid buying that first bounce - well, unless you are a fast-money trader, that is. An example here would be the December 2018 example, where we saw the end of the trade war and the Fed reversing course, which put an end to the panic and the market V-bottomed.
After the initial bounce, the original reason for the waterfall decline tends to resurface. This causes traders to put shorts back on and anyone who wants to sell does so. This is called the "retest" phase as prices move back toward the lows in some fashion. It is important to note that a "retest" isn't exact. I.E. Prices don't have to actually hit the prior lows. No, a "retest" can take the form of a move back toward the lows. Or prices can even exceed the lows. The point is that prices move back down from the initial bounce.
Finally, as the market discounts the crisis and the fear/uncertainty fades, stocks experience a period of "backing and filling," something we call the "bottoming process." Another lesson to recall is that markets can "handle" just about anything over time. And once the crisis is "handled" the bulls tend to resume control as it becomes clear that once again, the sky isn't really falling.
One of the keys here is that bottoms are usually a process and not an event. I would expect this to be the case with the current move as there isn't likely to be a single headline, tweet, or announcement that can turn things around. No, the market will have to get comfortable with the situation before it can move on - and this will likely take some time (think months).
The good news is that the bull market eventually resumes. Yep, that's right; good news can happen. The Fed can lend a hand. Governments can take action. And in the end, the market looks ahead to better days.
My Plan For Profiting From The Panic
While things certainly look tough here and the computers are definitely scaring the bejeebers out of individual investors, we should remember that this too shall pass. And unless the fundamentals of the market (rates, inflation, economic growth, and earnings) are impacted in a meaningful and sustained way, I believe the bulls are likely to resume control of the game in the few weeks/months ahead.
So, if you are one of the many investors who were looking to put money to work in the market a couple of weeks ago, here's your chance. To be clear, I am NOT calling a bottom here - nor will I ever try such foolishness. No, I am suggesting that if there is money that needs to be invested in stocks, you should consider putting some to work. Don't try to be a hero, simply invest over a period of time.
I.E. My plan for investing in a decline is to give yourself three buckets to buy with. Invest some now. Then add more if stocks go lower. And then add again if things get really ugly. You won't get the bottom, so don't even try. Instead, think about where the market is likely to be a year from now - or two/three years from now. The goal is to use this price break to position for the future - not try to buy the bottom tick.
Weekly Market Model Review
Each week we do a disciplined, deep dive into our key market indicators and models. The overall goal of this exercise is to (a) remove emotion from the investment process, (b) stay "in tune" with the primary market cycles, and (c) remain cognizant of the risk/reward environment.
The Major Market Models
We start with six of our favorite long-term market models. These models are designed to help determine the "state" of the overall market.
There are three changes to note on the Primary Cycle board this week. First, the Leading Indicators flip-flopped yet again this week; moving back into positive territory from neutral. Next, the Risk/Reward model also moved back to positive from neutral in response to improved sentiment indicator readings. And finally, the Global Risk Model slipped into negative territory. While the board sports a lot of green, it is worth noting that the readings of three models could easily change. So, at this stage, I'll call this long-term board moderately positive.
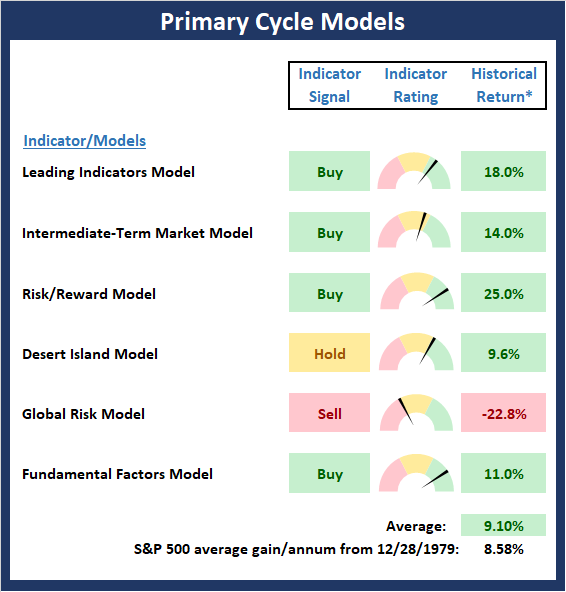
* Source: Ned Davis Research (NDR) as of the date of publication. Historical returns are hypothetical average annual performances calculated by NDR. Past performances do not guarantee future results or profitability - NOT INDIVIDUAL INVESTMENT ADVICE.
The State of the Fundamental Backdrop
Next, we review the market's fundamental factors in the areas of interest rates, the economy, inflation, and valuations.
There was one change to the Fundamental Factors board worth noting this week as the Valuation Composite improved from negative to neutral. So, with an uptick in the inflation model last week and valuations this week, I'll opine that the market's fundamental backdrop is improving. Yes, of course, there is economic uncertainty. However, if we can look past what I expect to be a temporary decline in economic output, there are some positives to take into consideration.
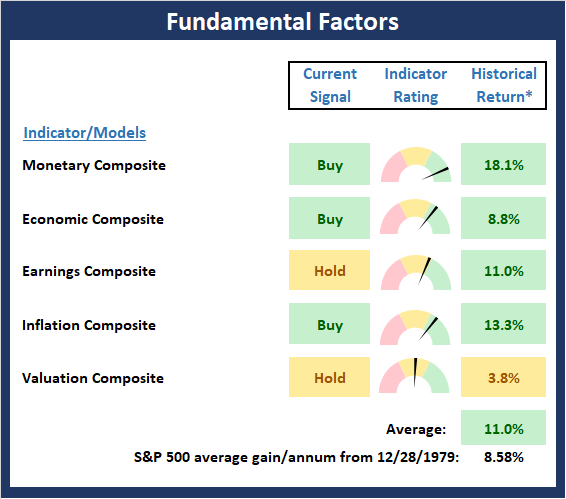
* Source: Ned Davis Research (NDR) as of the date of publication. Historical returns are hypothetical average annual performances calculated by NDR. Past performances do not guarantee future results or profitability - NOT INDIVIDUAL INVESTMENT ADVICE.
The State of the Trend
After looking at the big-picture models and the fundamental backdrop, I like to look at the state of the trend. This board of indicators is designed to tell us about the overall technical health of the current trend.
The fact that the Price Trend board took a hit last week shouldn't be terribly surprising. The bottom line is a 14% dive on the Dow in seven trading days is gonna leave its mark on just about any price and/or trend-oriented indicators. To be sure, we are witnessing a fear-based waterfall decline unfold in panicky fashion before our eyes. And yes, it is indeed scary to see technical levels snap like toothpicks. However, in looking at the bright side, I will point out that the cycle composite points higher over the coming month and the long-term trend model remains green.
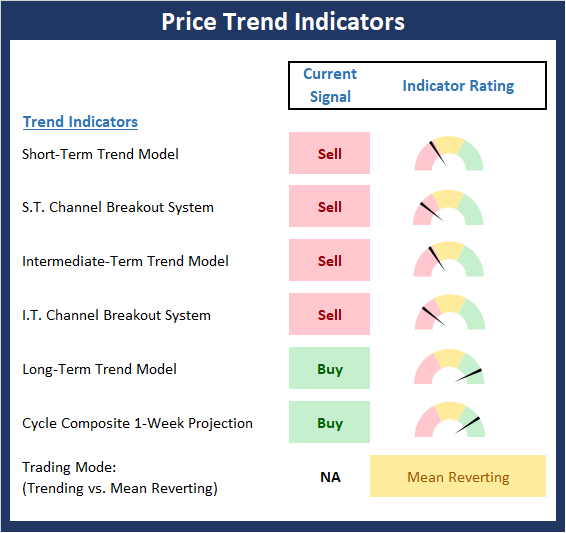
* Source: Ned Davis Research (NDR) as of the date of publication. Historical returns are hypothetical average annual performances calculated by NDR. Past performances do not guarantee future results or profitability - NOT INDIVIDUAL INVESTMENT ADVICE.
The State of Internal Momentum
Next, we analyze the "oomph" behind the current trend via our group of market momentum indicators/models.
While the trend board definitely had a tough week, the action on the momentum board was actually worse. In short, the board is now awash in red and there is lone indicator that remains on a buy signal. As such, we must recognize that the fast and furious trend break has been accompanied by ferocious selling. Yet, I think we can all agree that much of the action has been driven by computerized algo trading, which tends to become overdone. Thus, I'm going to take the momentum board with a grain of salt here.
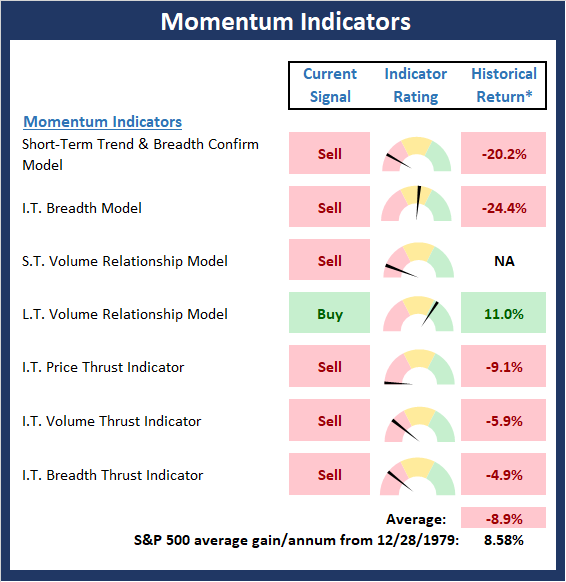
* Source: Ned Davis Research (NDR) as of the date of publication. Historical returns are hypothetical average annual performances calculated by NDR. Past performances do not guarantee future results or profitability - NOT INDIVIDUAL INVESTMENT ADVICE.
Early Warning Signals
Once we have identified the current environment, the state of the trend, and the degree of momentum behind the move, we then review the potential for a counter-trend move to begin. This batch of indicators is designed to suggest when the table is set for the trend to "go the other way."
As you'd expect after a thorough shellacking in the major indices, the Early Warning board is beginning to suggest that it might be time to go the other way for a while at some point soon. To be clear, the board is not in a "table pounding" position at this time. However, none of the indicators are negative and most are improving rapidly. Therefore, short-term traders should be on the lookout for the inevitable "dead cat" bounce. The question, of course, is if the bounce will hold or give way to a fresh round of selling. We shall see.
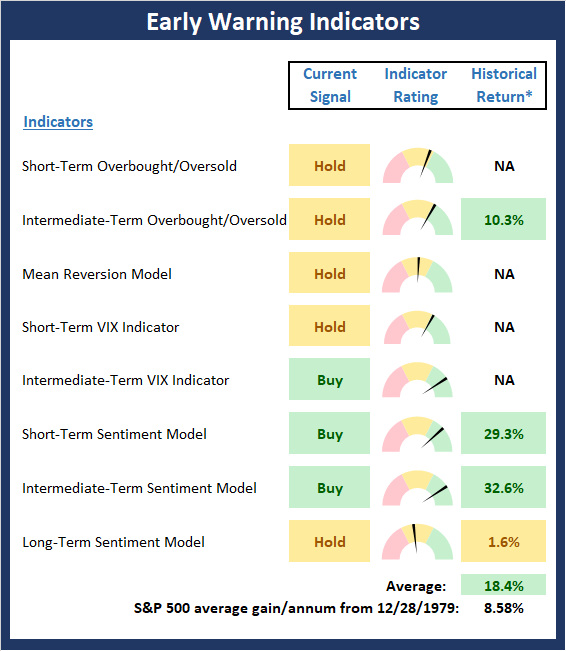
* Source: Ned Davis Research (NDR) as of the date of publication. Historical returns are hypothetical average annual performances calculated by NDR. Past performances do not guarantee future results or profitability - NOT INDIVIDUAL INVESTMENT ADVICE.
Disclosure: At the time of publication, Mr. Moenning held long positions in the following securities mentioned: none - Note that positions may change at any time.
The opinions and forecasts ...
more

