
The Oversold Chronicles End As A Fed-Inspired Stock Market Explodes Higher
AT40 = 20.4% of stocks are trading above their respective 40-day moving averages (DMAs) (ended 13 days in oversold territory)
AT200 = 14.9% of stocks are trading above their respective 200DMAs
VIX = 21.4
Short-term Trading Call: bullish (with caveats all over again)
Commentary
All oversold periods must end – it is just a matter of how and when. In the latest case, the oversold period took 13 days to run its course and ended in an explosive display of upside. The last three chairs of the U.S. Federal Reserve sat right at the ignition point as they met on an economic panel to play cheerleader for financial markets and the job the Fed does to steer good outcomes.
What happened on Friday was essentially a continuation of the bullish signs I pointed out on Wednesday. These signs were rudely and abruptly interrupted on Thursday thanks to poor economic data, a “shocker” earnings warning from Apple, and wild gyrations in the currency market (I covered it all in the last Above the 40 post). While stocks sold-off on Thursday, currency markets steadily healed and set-up financial markets for their own bout of healing on Friday. The Australian dollar (FXA) versus the Japanese yen (FXY) is still my favorite indicator of risk attitudes, and I followed it in awe as AUD/JPY led the recovery from Wednesday evening’s low liquidity, flash crash low. AUD/JPY managed to end the week essentially flat with its pre-flash crash price. I will now be a lot slower to close out my long AUD/JPY position.
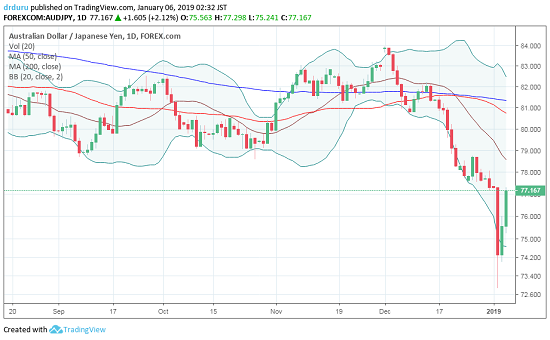
AUD/JPY took two days to completely reverse the loss from its flash crash. Can the upward momentum continue?
Source: TradingView.com
The chart above shows that the extreme of the flash crash was met by an extreme rebound. Stocks responded on Friday. The S&P 500 (SPY) gapped up and soared 3.4% to a 2-week high.
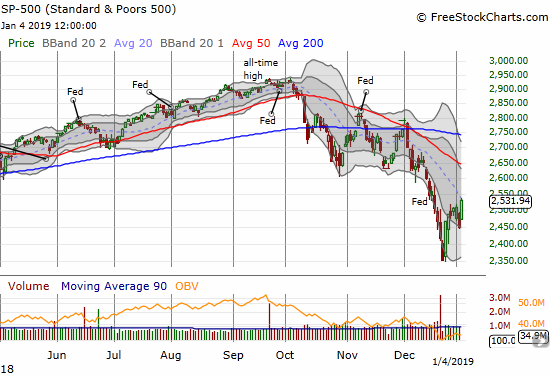
The S&P 500 (SPY) gained 3.4% and closed just under its downtrending 20DMA resistance.
Like the the S&P 500, the NASDAQ and the Invesco QQQ Trust (QQQ) jumped to their respective downtrending 20DMAs.
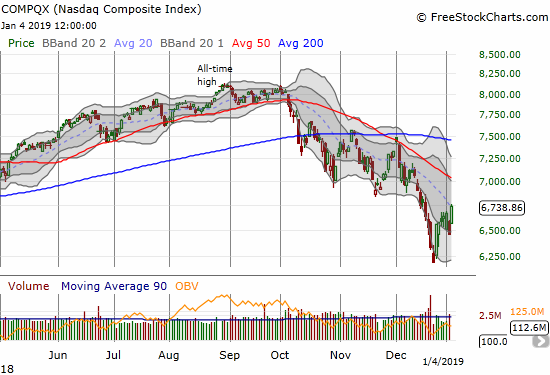
The NASDAQ gained 4.3% and closed on top of its downtrending 20DMA.
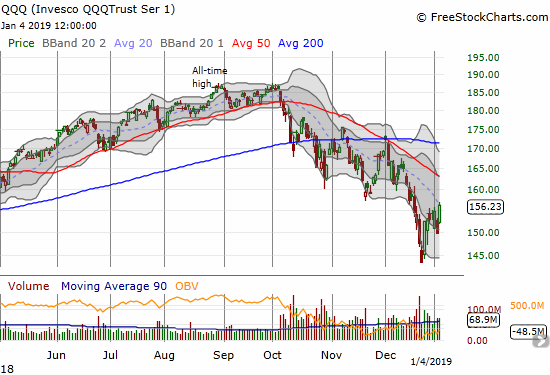
The Invesco QQQ Trust (QQQ) gained 4.3% to close just under its downtrending 20DMA.
The buying was so strong it propelled AT40 (T2108), the percentage of stocks trading above their respective 40-day moving averages (DMAs), out of oversold conditions. AT200 (T2107), the percentage of stocks trading above their respective 200-day moving averages (DMAs), reflected the deep technical damage remaining in the market by only managing a gain to 14.9%
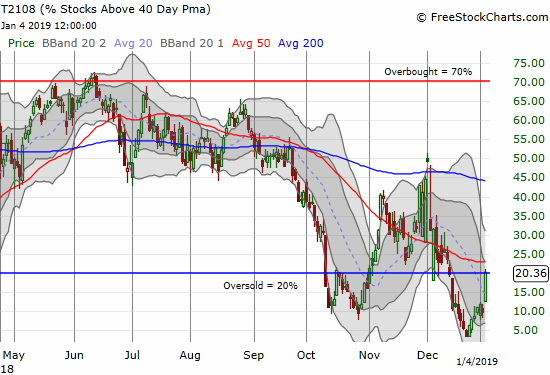
AT40 (T2108) surged to a 3-week high and created a V-shaped recovery from the depths of an extreme oversold period.
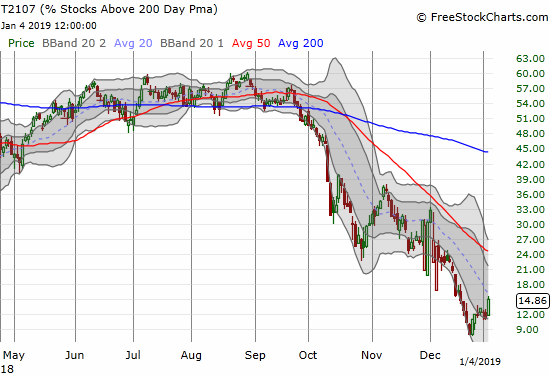
AT200 (T2107) jumped to a two week high but still reminds me of all the technical damage remaining in the stock market.
The S&P 500 finished the oversold period with a 2.6% loss. It opened the 13-day oversold period on December 14th (note I had to make corrections in past posts on duration of the AT40 periods). The performance was in-line with historical performance and just below the overall projection. Friday’s surge brought an end to the risk of “scenario 3” playing out in full for an extended downward trajectory in oversold conditions. The 13-day oversold period was one of the longest in history (dating back to 1987).
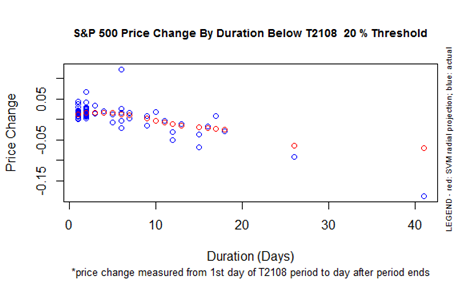
The performance of the S&P 500 for a given oversold duration (T2108 below 20%).
Given the marginal break out of oversold conditions, I am looking for an immediate follow-through of buying before calling a definitive end to the oversold period. Recall the October sell-off where two oversold periods were separated by just one day of trading. The second oversold period took the S&P 500 even lower than the first oversold period and rendered the end of the first oversold period nearly meaningless.
The volatility index continues to suggest that this latest period of elevated volatility is coming to an end. On Wednesday, I noted how I would have concluded the VIX hit a top absent knowing the after hours turmoil. The VIX did not jump nearly as much I expected on Thursday, and on Friday the fear gauge plunged again – this time by 16.0%. The VIX still looks topped out. I took profits on my single put on ProShares Ultra VIX Short-Term Futures (UVXY). I will resume fading volatility after a large spike and/or after the VIX drops below the 20 threshold. However, I will switch to long volatility around the 15.35 pivot line as hedging should get very cheap at that point.
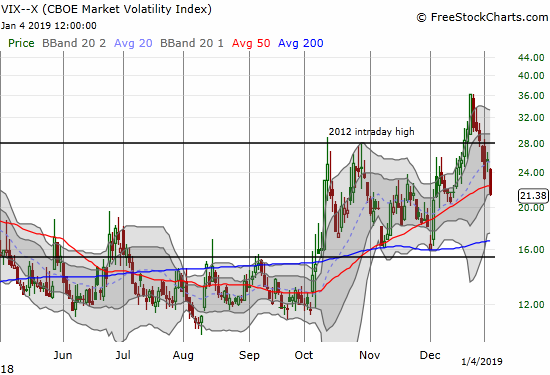
The volatility index resumed its plunge from the Christmas Eve peak. The VIX even closed below its own uptrending 50DMA.
In the last Above the 40 post, I lamented: “I absolutely hate feeling short-term bearish while the stock market is still in deep oversold territory. Yet, the trading action, and now the economic and financial data, point to an extended stay in bear market territory.” I granted one key upside scenario: “Perhaps to the upside, government action from China and/or the U.S. will trigger a buying opportunity (most likely from monetary policy and NOT trade policies).” Friday’s rally was a double reminder of the dangers of getting too bearish during an oversold period and of forgetting how central banks are ultimately beholden to respond to the misery of financial markets. While China made yet more moves to ease monetary policy on Wednesday and more on Friday, it was Friday morning’s Fed-speak that truly turned the tide.
Fed Chair Jerome Powell hung out with his immediate predecessors Janet Yellen and Ben Bernanke to talk monetary policy, the economy, and the economics profession at the American Economic Association’s annual meeting. Below I summarize and editorialize some key remarks and answers, but I encourage readers to watch for themselves. In particular, Powell’s market-moving commentary started around the 5:30 mark of the video. That moment may become a key turning moment for financial markets even if the major indices make new lows before rallying again.
Powell noted that monetary policy is all about risk management in a time full of conflicting signals from a strong domestic economy, economic weakness in China, and financial markets projecting concerns about the future. The market experienced a tectonic shift when Powell next proclaimed:
“As always, there is no preset path for policy. And particularly with the muted inflation readings, we will be patient as we watch how the economy evolves. We are always prepared to shift the stance of policy, and shift it significantly if necessary in order to promote our statutory goals…we will be prepared to adjust policy quickly and flexibly.”
This statement is standard Fed-speak and would have been unremarkable except that up to this point financial markets had become utterly convinced that Powell was deadset on hiking interest rates and keeping monetary policy on a one-way course no matter what. To me, this statement was a simple reminder of the reality of monetary policy: when push comes to shove, the Fed will move when absolutely necessary. In this case, the stock market’s near unrelenting sell-off put pressure on the Fed. As I stated after the Fed’s December pronouncement on monetary policy: “A Fed Undeterred Is A Stock Market Not Yet Low Enough.” Sure enough, prices went lower, and the Fed went to work.
In case anyone was still unconvinced of the Fed’s underlying flexibility, Powell recounted an example of Fed flexibility from 2015-2016. He gave the exact same example last month. I am sure Powell repeated this example specifically to set-up an important point: the market has misinterpreted the Fed’s methods and intentions. He even accused the market of excessive worrying (emphasis mine): “The markets are pricing in downside risks and are obviously well ahead of the data.” Despite this supposed unnecessary panic, Powell reassured markets that “…we are listening sensitively to the message that markets are sending. We will be taking into account those downside risks as we go forward.” Powell effectively said that the Fed is not worried about the economy but if markets worry enough about the economy, the Fed will (reluctantly?) take the downside risks more seriously.
Powell next addressed the issue of quantitative tightening through the reduction in the Fed’s balance sheet. Here again, Powell emphasized a flexibility that the Fed has already communicated in the past: “In 2014, we said that we would be prepared to adjust our normalization plans as appropriate….we wouldn’t hesitate to [make a] change… If we came to the view that the balance sheet normalization plan, or any other aspect of normalization was part of the problem, we wouldn’t hesitate to make a change.” Over and over again, Powell told financial markets that the Fed is flexible, responsive, and attentive. Moreover, he has been a part of the Fed decision-making apparatus for many years. It was clearly the exact reminder financial markets needed.
There were other interesting items in this meeting not covered in mainstream financial media. Most importantly, Powell, backed up by the historical references provided by his peers, reaffirmed in no uncertain terms that the Fed is independent and not subject to political whims. Powell specifically insisted that the Fed has a strong culture. These references were a direct repudiation of President Trump’s attempts to verbally bully the Federal Reserve into following the monetary policy desired by the White House. Yellen even cautioned that while Trump has the right to comment on the Fed, such public rebukes cut against the practices established by recent Presidents and threaten to undermine the public’s confidence in the Fed.
The panel also addressed whether the Fed actively works against the interest of the common worker. Starting with Yellen, the Fed chairs refuted the premise – now maniacally promoted by the likes of CNBC’s Jim Cramer as his own special method of shouting the Fed into acting in a pro-market way – that the Fed acts specifically against the best interests of workers by moving to cool the economy just as job markets heat up and drive wages higher. Yellen referred to the Fed’s data dependency and the difficulty in correlating employment growth to inflationary pressures. Powell also emphasized that the Fed has been very willing to review its estimates of the natural rate of unemployment. Bernanke noted that well-anchored inflation expectations allow the Fed more leeway in experimenting with monetary policy in an era when the link between unemployment and inflation is apparently so weak.
The market’s dovish interpretation of Powell’s comments also had an impact on the U.S. dollar index. The dollar was rejected from overhead 50DMA resistance and closed down on the day.
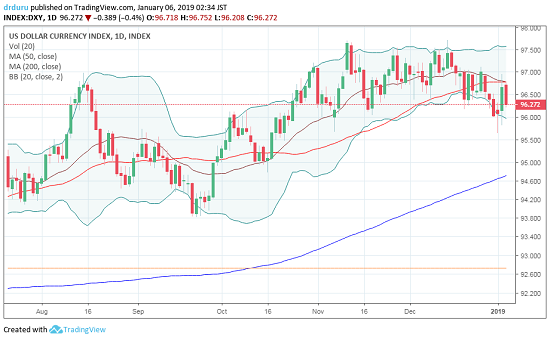
The U.S. dollar index (DXY) is slowly breaking down as it churns below its 50DMA
Source: TradingView.com
This currency action is convincing me to shift my bias from bullish to bearish on the U.S. dollar (without getting bullish on the euro though!). The dollar’s decline did not come with lower long-term rates. The iShares 20+ Year Treasury Bond ETF (TLT) gapped down and lost 1.2%, likely from a combination of a reduction in the fear that drove traders to the “safety” of U.S. Treasury bills and the strong December jobs report that allayed some fears of imminent economic weakness. I took profits on a tranche of TLT puts I purchased the previous day as TLT stretched far above its upper Bollinger Band (BB). This TLT fade is a new strategy I added to the toolkit for this interesting period where U.S. economic data can still deliver good news even as the fear trade drives TLT higher.
Looking back on all this Fed-driven drama, I now wonder whether this episode was just another experiment very similar to the “Taper Tantrum” where the Fed first floated the idea of getting started with monetary tightening. The market’s reaction was so negative that the Fed soon had to dial back its language and soothe financial markets. The reaction to Yellen’s first rate hike was also very negative and, once again, the Fed had to coo the market out of its panic. So here we are again. Powell flirted with outright hawkishness including floating the idea of putting tightening on a near automatic schedule, observed the market’s deeply panicked response, and is now working to calm the markets. The stakes are high given China’s economic weakness and U.S. economic numbers that are so strong they are unlikely to get much better from here.
Trading Discussion
Friday was of course a big up day for the oversold trading strategy and the kind of validation I always enjoy. If the oversold period had not dragged on so long, I would have held onto more long positions. Instead, I actively took profits. I was relieved to see that I was not over-hedged, and of course I pushed forward on fresh hedges (see below). For good measure, I added a calendar put spread on Adobe (ADBE) which is still negative post-earnings. I salvaged residual value on SPY call options that I just mistimed from the previous week. I restarted my secular bet against Walgreens Boots Alliance (WBA) with a short right at 200DMA resistance. I anticipate avoiding opening new bullish bets on Monday as I await confirmation of the end of this latest oversold period (see below for the Apple exception). I kept the short-term trading call at bullish.
CHART REVIEWS
Amazon.com (AMZN)
It is always amazing to see a stock as large as AMZN move in big chunks. AMZN gained 5.0% and challenged 50DMA resistance. AMZN is up an incredible 17.2% from its Christmas Eve low. I have been playing AMZN from the (net) long side given it was one of the few stocks printing a clear bottoming pattern during those depths of the oversold period.
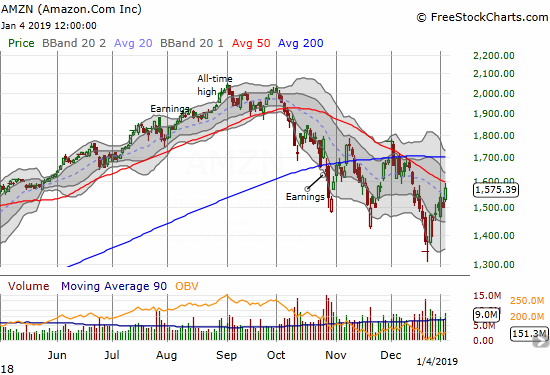
Amazon.com (AMZN) gained 5.0% after pulling back slightly from downtrending 50DMA resistance.
Chipotle Mexican Grill (CMG)
Several stocks have made impressive V-like bottoms from the Christmas Eve lows. CMG is 17.9% off its low. Unlike AMZN, I somehow managed to miss this entire move. Having said that, I think the area between the 50DMA and the recent highs should present very stiff resistance.
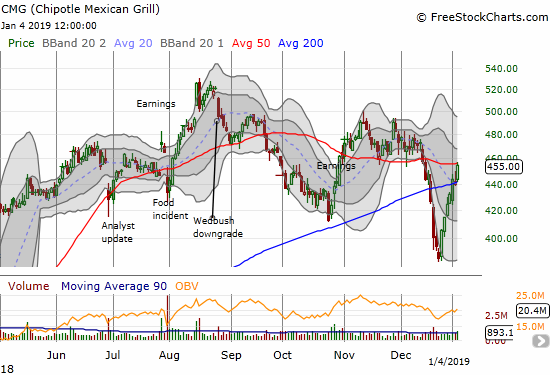
Chipotle Mexican Grill (CMG) confirmed its 200DMA breakout with a 3.5% gain but closed just under 50DMA resistance.
Apple (AAPL)
AAPL is already moving for redemption after helping to lead the market lower on Thursday with its big revenue warning. I neglected to buy call options for the weekly play. In this case, that purchase should have been Thursday or at Friday’s open. I was too focused on the bearish implications of Apple’s news. I will buy some weekly calls if AAPL dips on Monday.
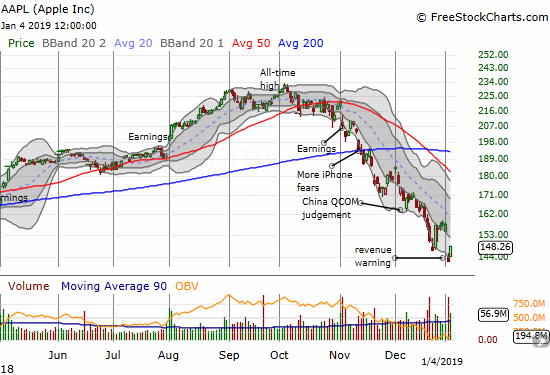
Apple (AAPL) gapped up and kept powering higher for a 4.3% gain.
Bitauto (BITA)
BITA looked bullish for just a hot minute. The subsequent nosedive was a great reminder of the importance of follow-through to confirm a trade setup. BITA is below its downtrending 200DMA again and is no longer a buy. Aggressive traders could still go in with a stop below the 50DMA.
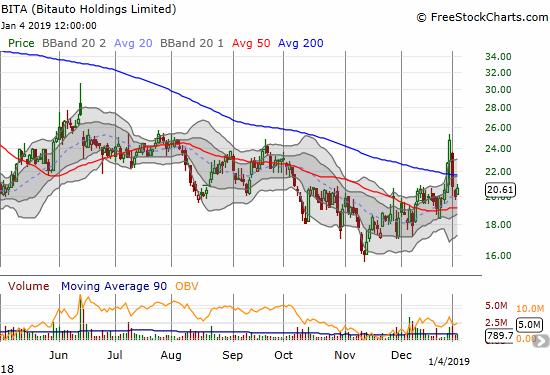
Bitauto (BITA) gained 3.1% in an attempt to stabilize at uptrending 20DMA support.
Netflix (NFLX)
The days of buying NFLX puts as a hedge against bullish positions came to a temporary end after Goldman Sachs (GS) added the stock to its conviction buy list (I have a “residual” put left from a calendar put spread – the short side expired on Friday). The timing was perfect for NFLX given the market’s explosive day. NFLX made a very bullish move on Friday as it broke out above its 50DMA resistance which also defined its current downtrend. The stock gained 9.7%, closed at its high of the day, and stood tall above its upper Bollinger Band (BB). I will not dare to touch it again until/unless it closes below its 50DMA again and/or it tests 200DMA resistance.
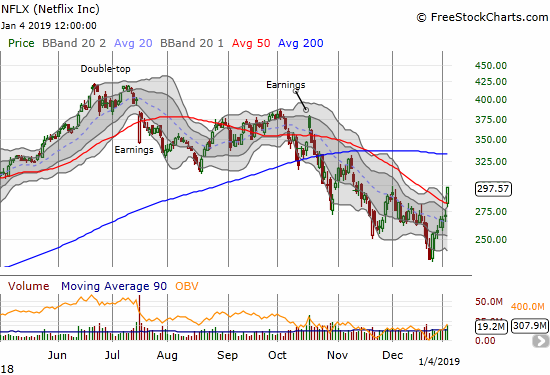
Netflix (NFLX) soared 9.7% on a picture-perfect breakout above its 50DMA and a close above its upper Bollinger Band.
This fantastic Saturday Night Live (SNL) skit summarizes the longer-term bearish case on NFLX: too much spending on too much content for small/niche audiences.
Goldman Sachs (GS)
GS is also looking more short-term bullish. The stock gained 3.3% and cleanly cleared its downtrending 20DMA. Overhead resistance at the downtrending 50DMA is now in play which should be good for at least a 10% gain from current levels. Like NFLX, I have put a temporary hold on using GS as a hedge against bullish positions, but I bought a last put for good measure. GS gets interesting again on the short side at 50DMA resistance or a close below its 20DMA.
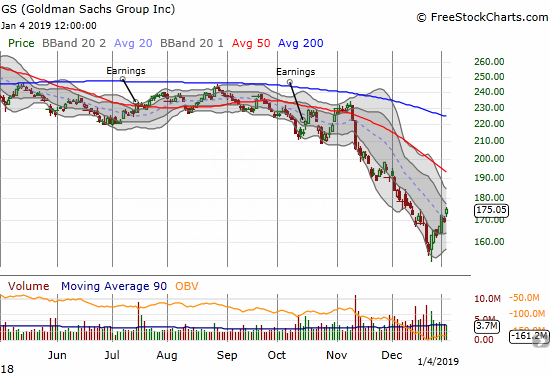
Goldman Sachs (GS) gained 3.3% with a clean clearing above its downtrending 20DMA resistance.
iShares US Home Construction ETF (ITB)
Home builders are suddenly looking better with individual stocks stabilizing. ITB confirmed the improving picture with a close above its 50DMA. ITB has spent very little time above this critical moving average since the big 50DMA breakdown almost a year ago!
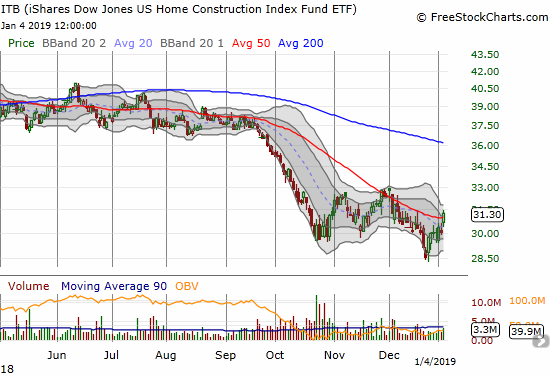
The iShares US Home Construction ETF (ITB) managed to breakout above its downtrending 50DMA resistance with a 4.1% gain.
Meritage Homes (MTH)
MTH is one of those stabilizing home builders. The stock followed through on its 50DMA breakout and is back to recent highs. Overhead resistance at the 200DMA is in play. Also note the higher low with October holding as the major low.
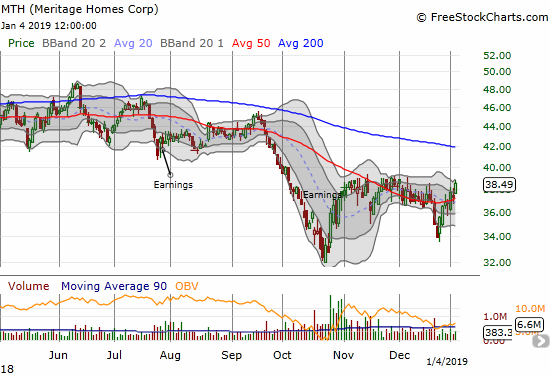
Meritage Homes (MTH) gained 3.4% and closed at recent highs and is on the edge of confirming a 50DMA breakout and higher low.
LGI Homes (LGIH)
LGI keeps looking stronger and stronger. It broke out to a near 4-month high and closed above its upper-BB. The stock is sneaking upward with higher highs and higher lows.
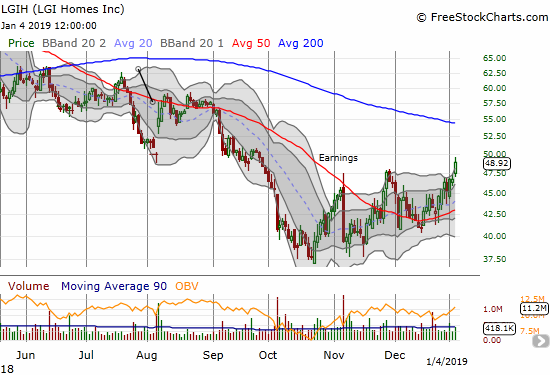
LGI Homes (LGIH) gained 4.7% for a near 4-month high.
Pulte Homes (PHM)
PHM is now so strong it is mounting a challenge to overhead resistance from its 200DMA, its first such challenge since last July. The stock broke out cleanly to a 4-month high.
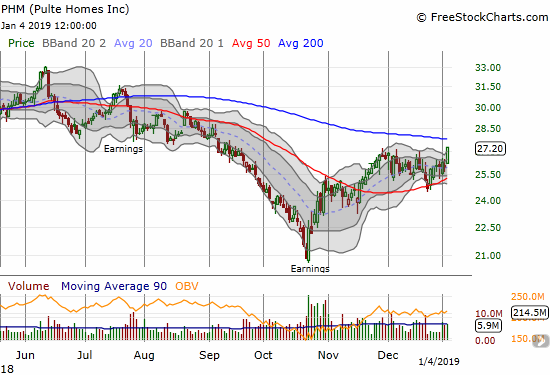
Pulte Homes (PHM) gained 4.9% to a 4-month high and now sits just below 200DMA resistance.
Toll Brothers (TOL)
TOL made its own clean breakout that puts its overhead resistance at the 200DMA in play. The buying was strong enough to hold TOL above its upper-BB with a 5.1% gain and a 3+ month high.
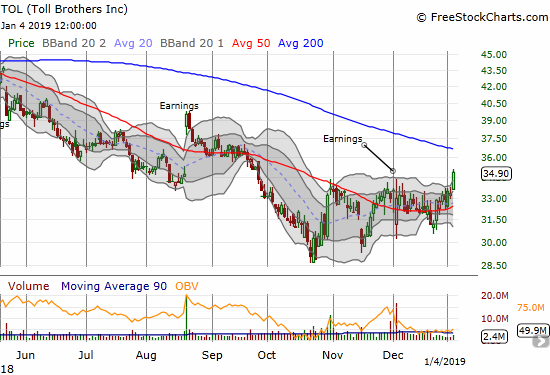
Toll Brothers (TOL) soared 5.1% to a 3+ month high and closed above its upper-BB.
Intel (INTC)
I neglected to reload on INTC call options on Thursday’s big dip for my between earnings play. My current set of call options got a small boost but with a $50 strike, time is running out. Moreover, earnings are coming up on January 24th.
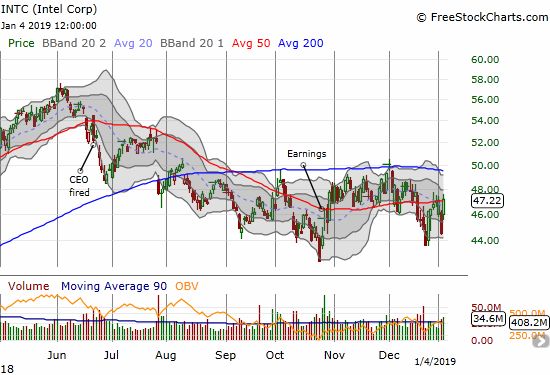
Intel (INTC) jumped 6.1% and closed just above its 50DMA and right at recent highs.
iShares Russell 2000 ETF (IWM)
IWM broke out over recent consolidation. I used the rally to take profits on a call option I bought earlier in the week (I should have bought fresh SPY calls at the same time!). I still like IWM for a run-up to downtrending 50DMA resistance; those prospects get a lot better the longer the market stays out of oversold territory.
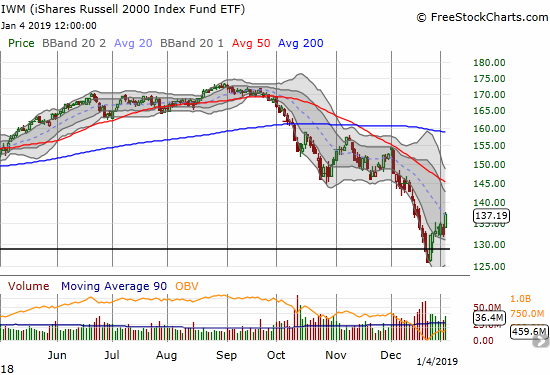
The iShares Russell 2000 ETF (IWM) gained 3.7% and closed just above its downtrending 20DMA.
Caterpillar (CAT)
CAT still qualifies for my toolkit of hedges. I used the big dip on Thursday to take profits on my put options (and sold too early). I used Friday’s rally to reload. I still expect CAT to warn and/or report poor earnings. If I am wrong, I will boost my overall expectations for the stock market in general.
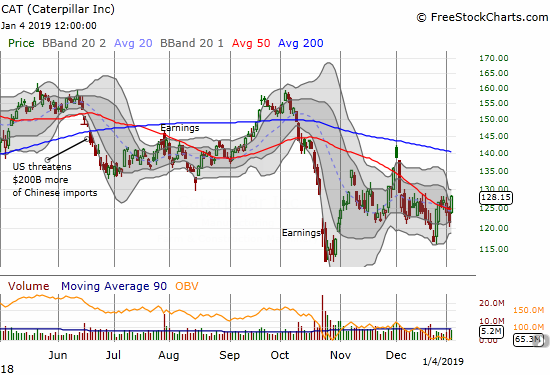
Caterpillar (CAT) gapped up and powered right through its 50DMA for a 5.5% gain.
Best Buy (BBY)
BBY also still qualifies for the hedging toolkit. I loaded up on put options on Thursday and duly noted how BBY struggled to go anywhere on Friday. While most of the market was soaring in Fed-inspired celebration, BBY only pushed upward by 0.5%. I was surprised by the sluggishness given the strong jobs report.
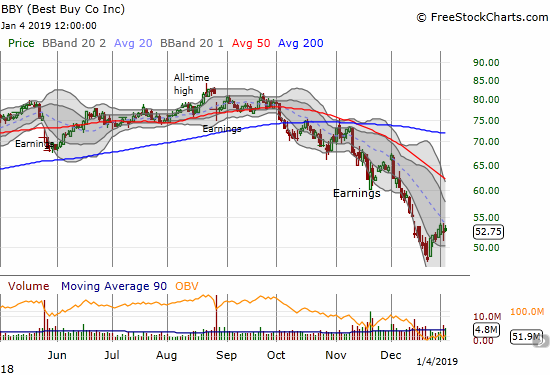
Best Buy (BBY) only gained 0.5% as its upward momentum from recent lows continues to wane.
— – —
“Above the 40” uses the percentage of stocks trading above their respective 40-day moving averages (DMAs) to assess the technical health of the stock market and to identify extremes in market sentiment that are likely to reverse. Abbreviated as AT40, Above the 40 is an alternative label for “T2108” which was created by Worden. Learn more about T2108 on my T2108 Resource Page. AT200, or T2107, measures the percentage of stocks trading above their respective 200DMAs.
Active AT40 (T2108) periods: Day #1 over 20% (overperiod ending 13 days oversold), Day #19 under 30% (underperiod), Day #21 under 40%, Day #71 under 50%, Day #87 under 60%, Day #142 under 70% (includes several corrections)
Daily AT40 (T2108)

Black line: AT40 (T2108) (% measured on the right)
Red line: Overbought threshold (70%); Blue line: Oversold threshold (20%)
Weekly AT40 (T2108)

*All charts created using freestockcharts.com unless otherwise stated.
Disclosure: Long SSO, long AUD/JPY, net short U.S. dollar, long AMZN call spread, long BBY puts, long CAT puts, long GS put, long NFLX put, long INTC calls, net long AAPL shares, long ITB calls, long ...
more

