Tuesday, December 31, 2019 11:18 AM EDT

In our 7 must-read cryptocurrency predictions 2020 as well as our Bitcoin price forecast 2020 we said to be convinced that the grand crypto bull market is set to continue. Admittedly, things may be choppy in the short to medium term. But directionally the crypto market will move higher, especially the largest cryptocurrencies like BTC and XRP.
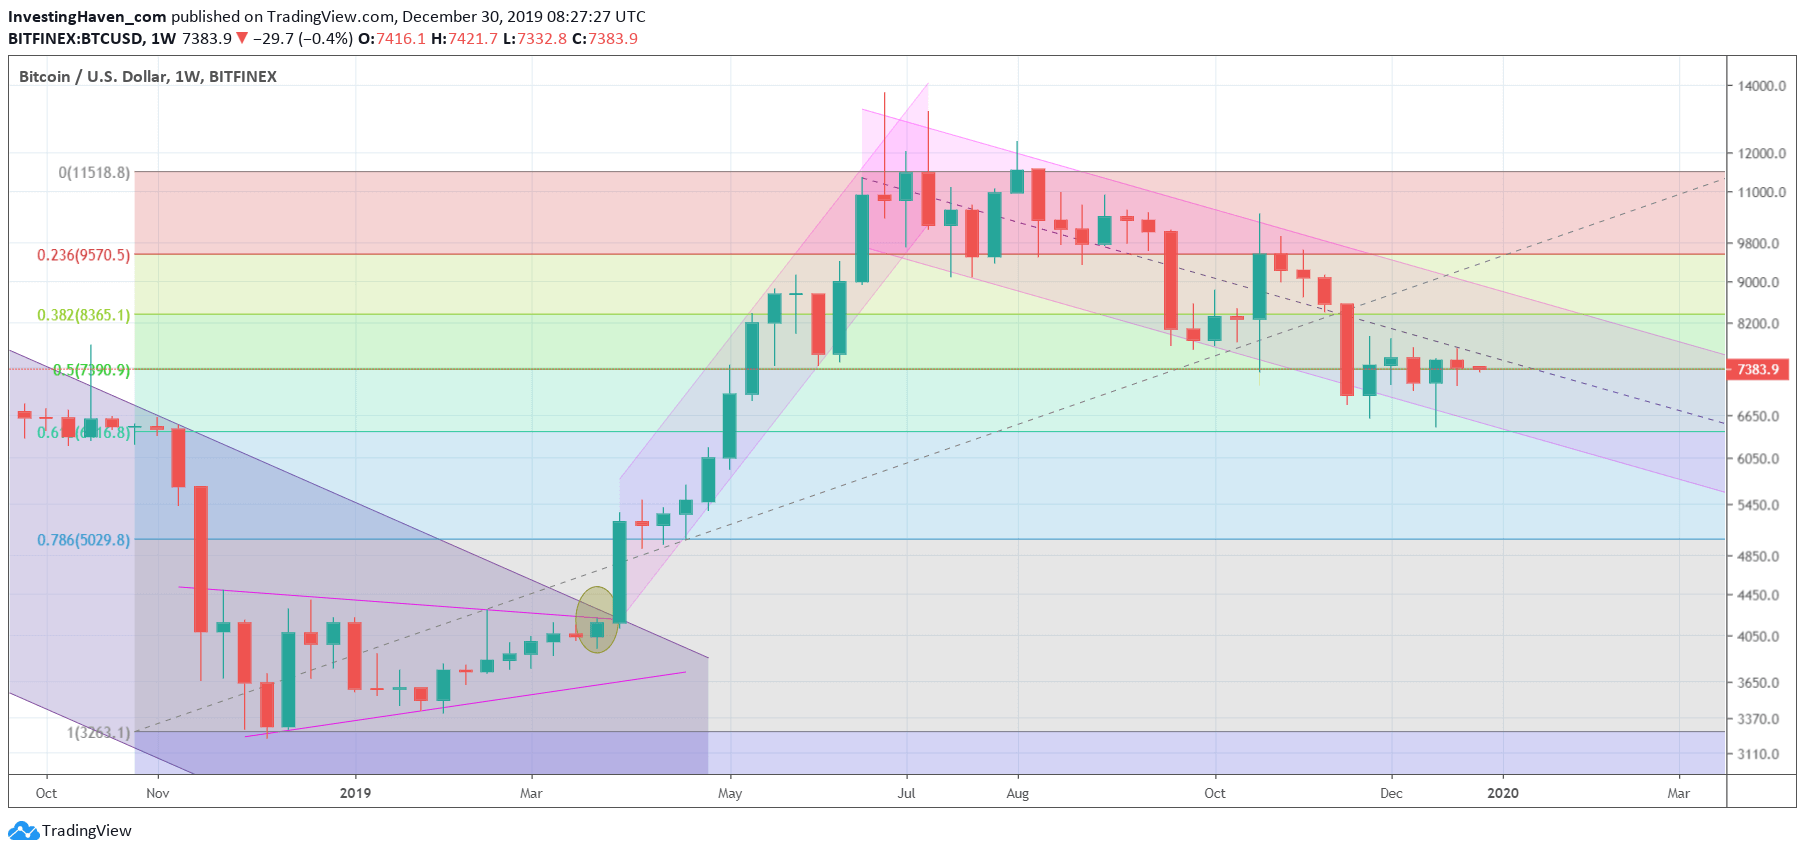
If we carefully look at the Bitcoin chart, the leading indicator for the crypto market, we see an increasing number of signs of a bottoming process.
Now the word bottom is one of the most misused words, especially with the proliferation of social financial media.
When we use the word ‘bottom’ we tend to mean the end of a retracement period, either a tactical or a secular retracement. In other words, a reversal is in the making.
In the case of Bitcoin, we have been working with the daily chart. However, when we apply the Fibonacci retracement technique to the monthly chart in order to find ‘the bottom of a retracement’ (or in other words the confirmation of a reversal) we might see have some very interesting news for crypto investors.
The recent sell-off stopped exactly at 6666 USD. On the monthly chart, working with monthly closing prices, the Fibonacci retracement level that coincides with 6666 USED is the 61.8%. More interestingly, prices currently are set to close this month at the 50% retracement level.
(Click on image to enlarge)
All this obviously will only be accurate if our approach of monthly closing prices is a valid approach. We will track this closely, and report back to our followers both in the public domain in ...
more
All this obviously will only be accurate if our approach of monthly closing prices is a valid approach. We will track this closely, and report back to our followers both in the public domain in our crypto news category (high-level conclusions) as well as our premium crypto members (very detailed findings made actionable).
Disclaimer: InvestingHaven.com makes every effort to ensure that the information provided is complete, correct, accurate and updated.In spite of these efforts, errors may occur in the information provided.If the information provided contains errors or if certain information is not available on or via the site, InvestingHaven.com will make every effort to rectify the situation as soon as possible. However, InvestingHaven.com cannot be held liable for direct or indirect damages resulting from the use of the information on this site. If you notice any errors in the information provided via the site, please contact the manager of the site.
Moreover, the views expressed in the articles (posts) on this website are the ones from the authors and are for information only. It is not intended as an offer, invitation, or solicitation to buy or sell any of any security or asset described. Nor the website manager nor the authors do accept any liability whatsoever for any direct or consequential loss arising from the use of their content. Please consult a qualified financial advisor before making investments. The information on this website and in the articles (posts) is believed to be reliable , but the authors do not make any representations as to its accuracy or completeness.
The content of the site (including links) may be adjusted, changed or expanded at any time without notice.
InvestingHaven.com cannot be held liable under any circumstances by anyone, directly or indirectly, in any specific or other way, for damages resulting from the use of links or hyperlinks, including, without limitation, any losses, interruptions of work, damage to programmes or other information on the computer system or to equipment, software or other items owned by the user.
less
How did you like this article? Let us know so we can better customize your reading experience.


