
The “Knockin’ On Heaven’s Door” Stock Market

This week we chose Bob Dylan’s classic, Knockin’ on Heaven’s Door; to characterize the current status and sentiment of the Stock Market.
Knock-knock-knockin’ on heaven’s door
Knock-knock-knockin’ on heaven’s door
Knock-knock-knockin’ on heaven’s door
Knock-knock-knockin’ on heaven’s door
On January 21 I said:
The stock market can correct in TIME or PRICE. While I do think we may push a bit higher first, I expect the market will finally begin to consolidate some gains in coming weeks.
This can be by simply grinding sideways for a month or two to digest the > 75% gains off the March Lows OR more likely get a health pullback. As we have stated in recent weeks, this is the beginning of a new business cycle and it does not pay to get too cute trying to predict the when and how much of a short term correction we will get.
As we saw after a monster rally off the lows in 2009, it did not pay to play the short term pullbacks in 2010 and 2011 – as you may very well have missed out on a decade long bull market run.
We’ll be using any weakness that potentially comes our way in Q1 to add more value/cyclical names (themes listed above) to hold for the next 3-5 years…”
“do not underestimate the impact of $10T to solve a $750B problem.”
If/when we get some consolidation or a pullback, do not expect it to be material or long in duration.
Last week I said:
We got a 3.7% pullback last week. Was that it? It’s too early to tell. If it follows our post-election 2017 model – there were no pullbacks that exceeded that range (3-4%) for the full 12 months.
While there are CLEAR pockets of froth and EXUBERANCE, it is not the case for the entire market as a whole. We will dissect the risks and opportunities below.
On Tuesday I was on Fox Business – the Claman Countdown – with Liz Claman. (Thanks to Liz and Jacqueline D’Ambrosi Scales for having me on.) Liz asked me about the online gaming and online betting businesses as well as whether “stay at home” stocks would stop working. Watch here for my thoughts at the beginning, and an alternative way to play the online betting trend (at the end).
Over the weekend, Larry Mendte aired a segment we did on GameStop. on his “Jersey Matters” show on NJNNTV.
This is a definitive; what happened, how it happened, what it means going forward, and some suggested remedies (for those of you who can’t get enough of this drama!).
So are we in a Bubble?
On January 28 we put out the chart below in the context of the general market being due for a pullback. We got almost 4% in the next couple of days.
This week we’re going to think about it from a different context as we have many crosswinds at play.
What do Mick Mulvaney, Colin Kaepernick and Paul Ryan have in common?
They are raising SPACs. In any normal market, when raising money, the simple question everyone asks is, “show me your track record.” If you’re raising money for a fund, you’re sending your performance. If you’re raising money for a business, you show how you did for your investors in the past.
In today’s market it has become, “oh yeah, I’ve heard of him/her, I’m in!” That is a clear area of froth. Many SPACs won’t get a deal done, or even worse, force a bad business through so they can get paid.
The seasoned investors that raised SPACs will likely succeed – as their track records indicated a high likelihood of investing success and experience – but the others are a coin flip at this stage. It’s no different with some of the IPO valuations and penny stock ramps we are seeing lately.
So then how do we know whether it’s a bubble or not???
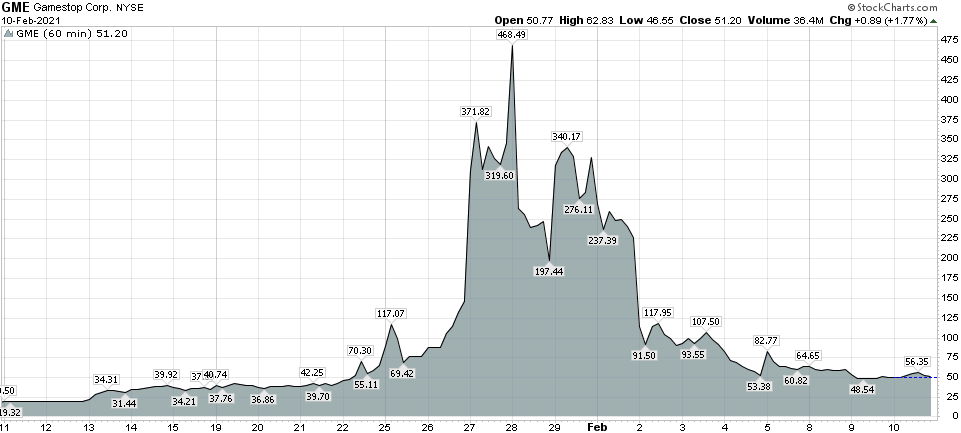
I think there are pockets of the market and certain assets that may prove to be a bubble over time. As I said on January 26 in Reuters (regarding GameStop), “Will it end badly? Sure. We just don’t know when.”
I think the same is true with certain IPO’s, SPACs and penny stock pumps, but we don’t know when.
In the mean time, while stock correlation tends to drop before a correction, it ALSO indicates periods WHEN STOCK PICKERS OUTPERFORM.
This initial drop in correlation is similar to early 2017 (after the election). We pointed to 2016-2017 as a possible roadmap in our October 29 “Back to the Future” article – which made the case to pile into banks and energy – when everyone was puking them out ahead of the election.
If this roadmap holds, we could see a scenario where the indices pull back 3-4% multiple times, but never materially more than that for some time.
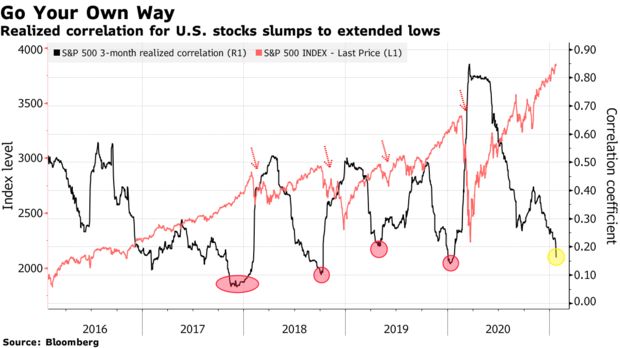
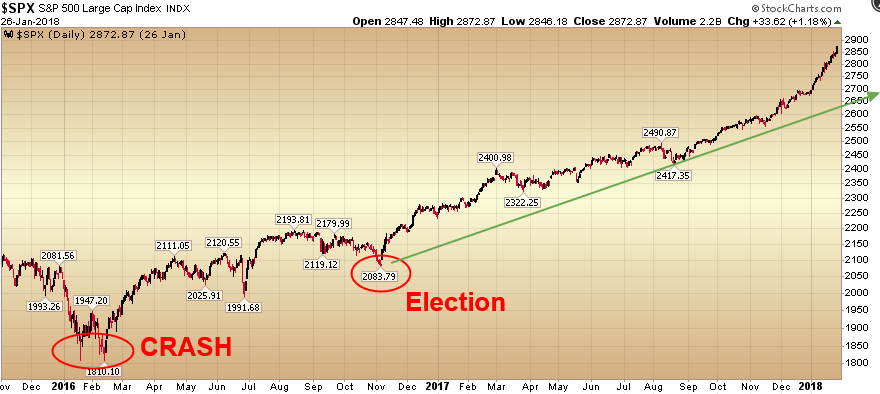
Here is what 2016-2017 looked like (crash, election weakness, rally):
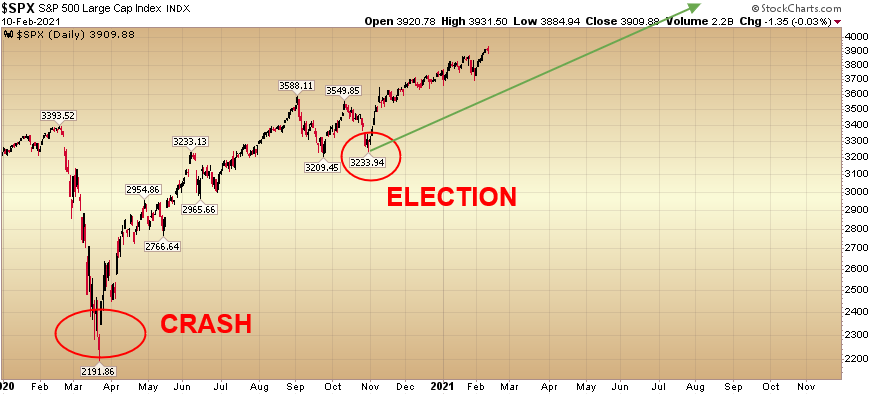
Here is what 2020-2021 looks like so far (crash, election weakness, rally):
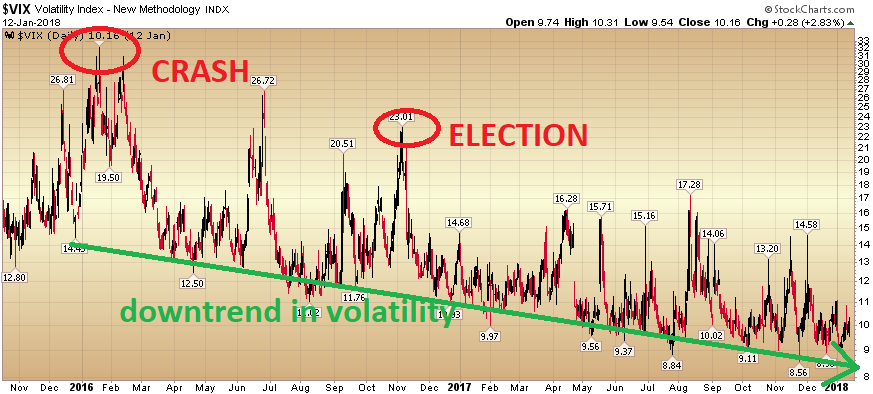
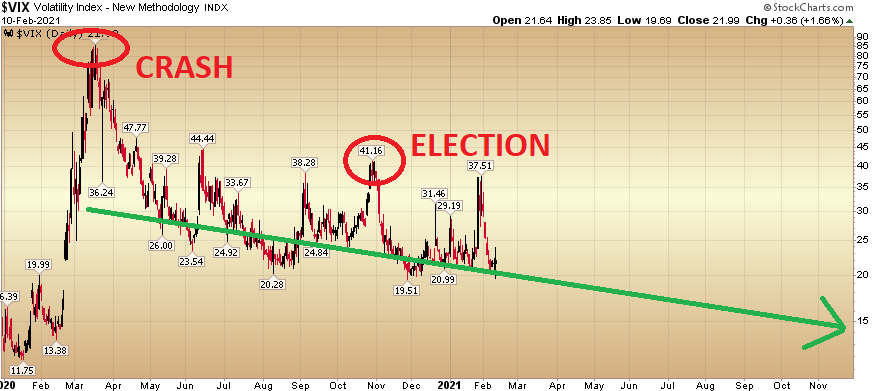
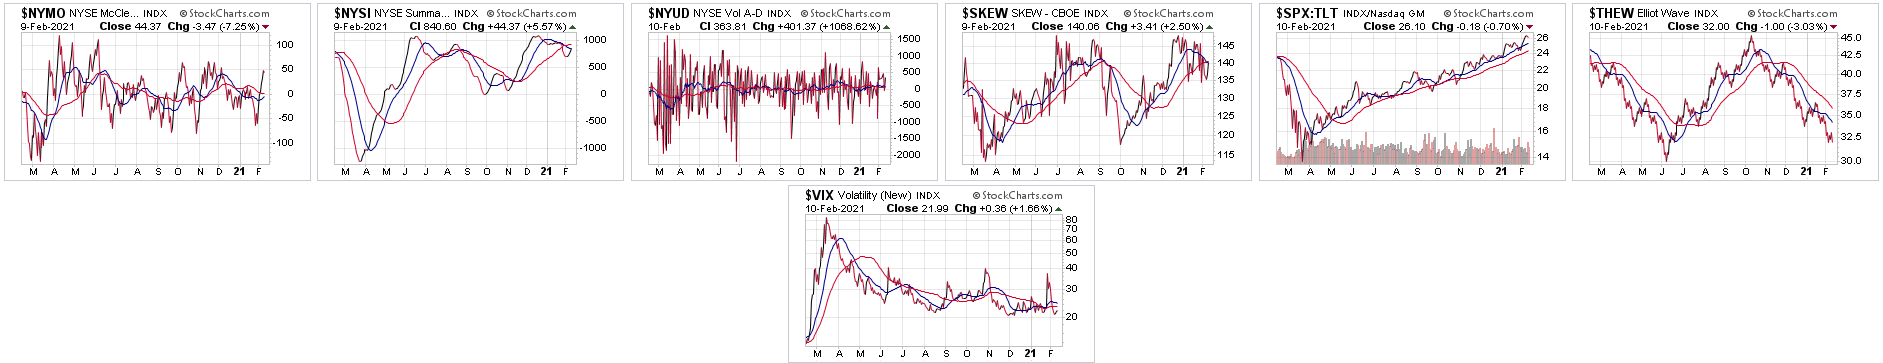
The reason it’s hard to call the market a bubble (besides unlimited liquidity, stimulus and global re-opening) is because the Volatility Index is still elevated. When at-the-money insurance premium is historically expensive, it means there is still massive demand for protection (that is not the sign of the complacency often found at market tops).
Here is what 2016-2017 VIX (volatility index) looked like (crash, election weakness, rally):
Here is what 2020-2021 VIX (volatility index) looked like (crash, election weakness, rally):
So will we have more pullbacks, consolidation and volatility? Sure. But it may be less pronounced than many think. Multiple mini pullbacks in the indices are plausible, but there is still a ton of money to be made “under the surface.”
We have talked about ignoring the indices and playing for monster rallies “under the surface” many times in our recent podcasts/videocasts. When correlations are this low, and there is still fear in the market (and rates are rising), the environment is highly favorable for stock pickers.
When you hear that it’s a bubble, walk through these stocks below and ask yourself if these stocks are in a bubble. Do they look like they are topping or bottoming?
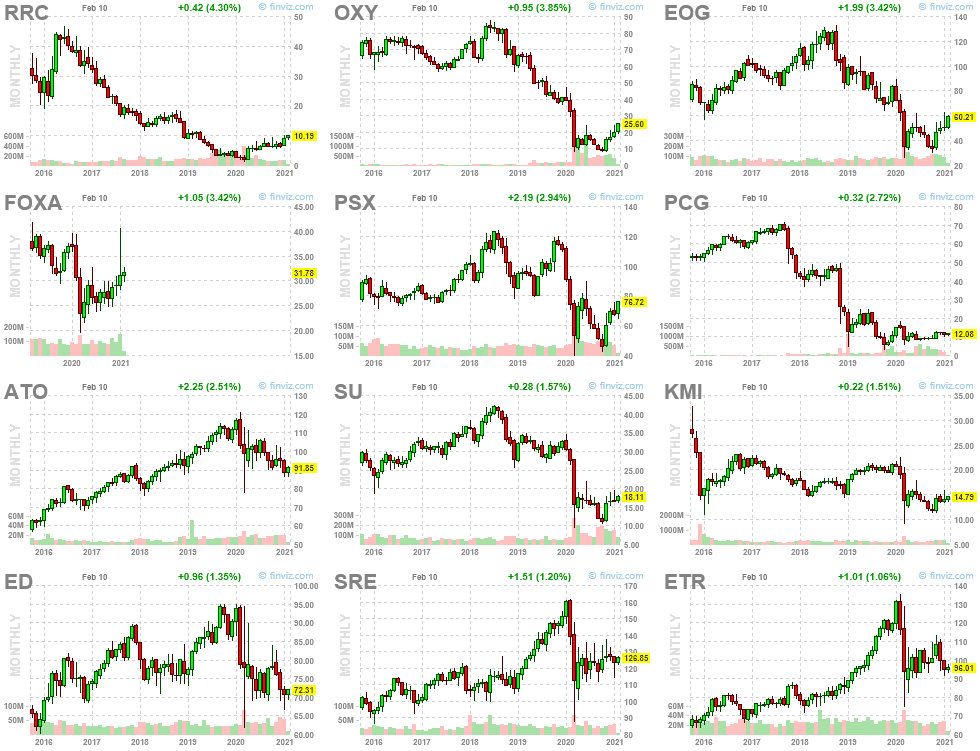
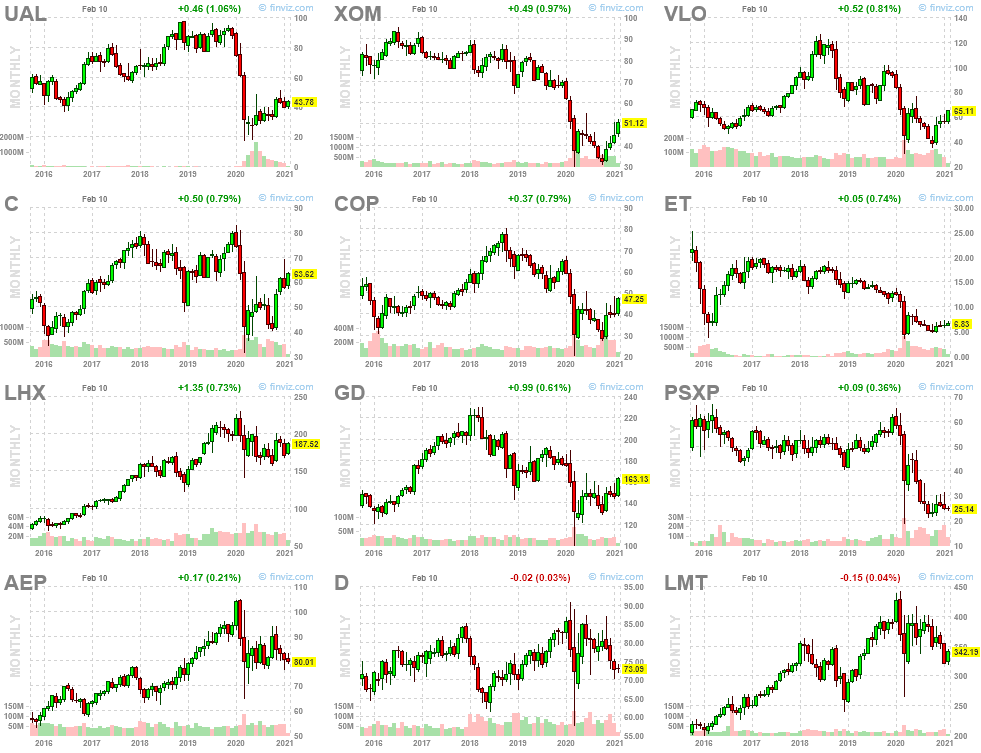
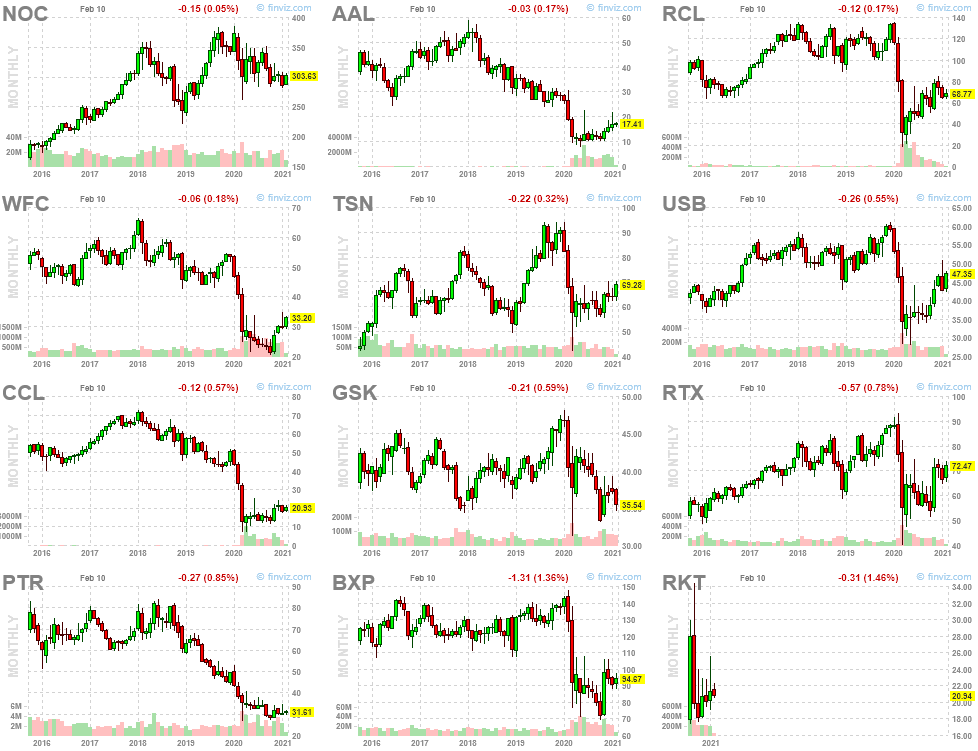
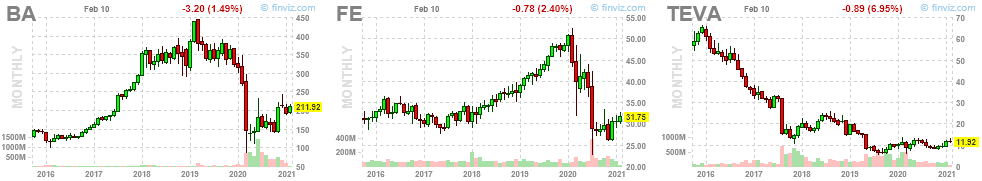
There’s a bull market somewhere, you just have to know where to look. This does not mean we will not correct more than 3-4%, it just means we are digging below the surface to extract the greatest opportunities moving forward.
Indicators
Many of the market indicators we look at on a regular basis are closer to the top of their range than the bottom, so we’re not “pound the table” bullish (on the indices) by any means (we were in Late March and Early April) – you can review all of our notes here.
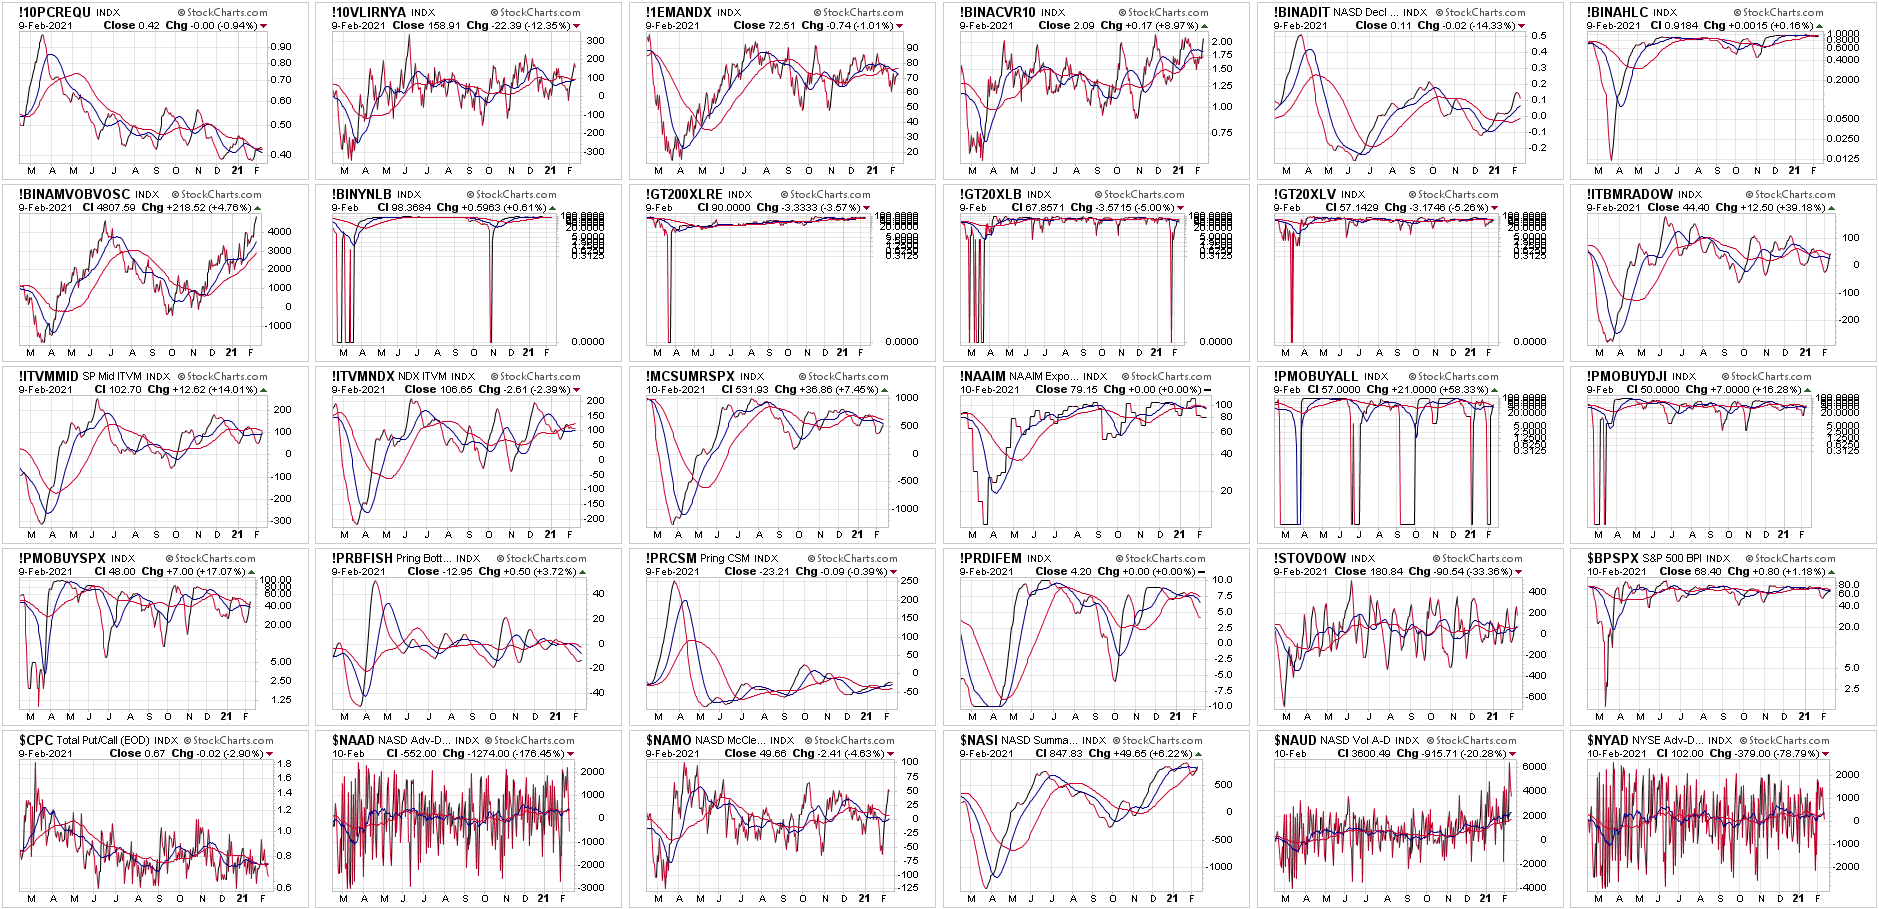
We are however “pound the table” bullish on certain sectors and stocks that we have pointed out on recent podcasts/videocasts.
We believe there is tremendous opportunity over the next 12-18 months in Defense & Aerospace, Banks, and Energy. At today’s levels, we believe Defense & Aerospace is the greatest value if we had to put NEW money to work today. These groups can do well even if the general indices flounder, and can do even better if the bull run persists (on a relative basis).
Mind the Gaps
For those insistent that the 3.7% correction was not enough of a consolidation, if 2017 is any guide, we’ll get another one (pullback). We got five mini-pullbacks in 2017 that were 3-4% in magnitude. Where might the obvious targets be with so much liquidity? There are a couple of unfilled gaps that may be helpful targets in the event of another mini-pullback.
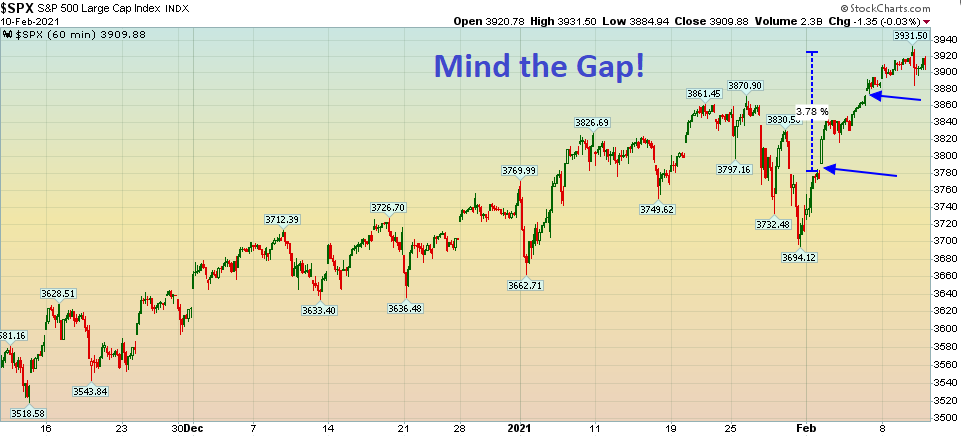
These will be helpful to us only if they create meaningful pullbacks in individual names we want to accumulate in: Defense & Aerospace, Banks, or Energy. If not, we will ignore and ride them out.
Don’t Fight the Richest Guy in the World
No, I’m not talking about Elon Musk. I’m talking about Jay Powell. Musk plays in Billions, Powell plays in Trillions.
Yesterday, Fed chair Jerome Powell said the employment picture is “a long way” from where it needs to be and that rates will stay low for a while. Here’s all you need to know the next time you want to aggressively short the market this year:
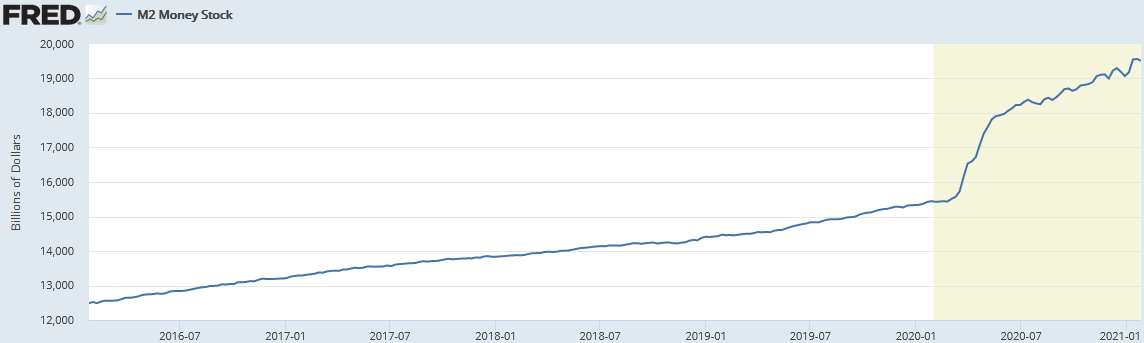
M2 Money Supply is up ~26% year on year.
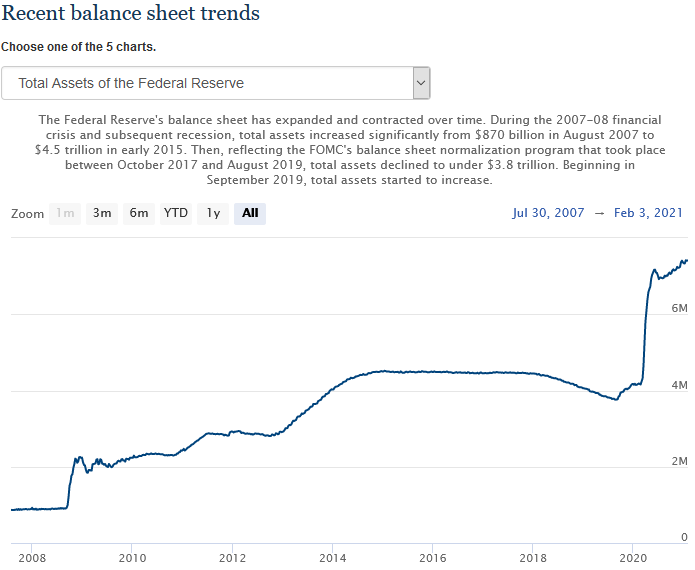
Fed Balance sheet is at $7.4T.
And if Secretary Yellen/President Biden have their way, trillions more in Fiscal Stimulus is coming in 2021…
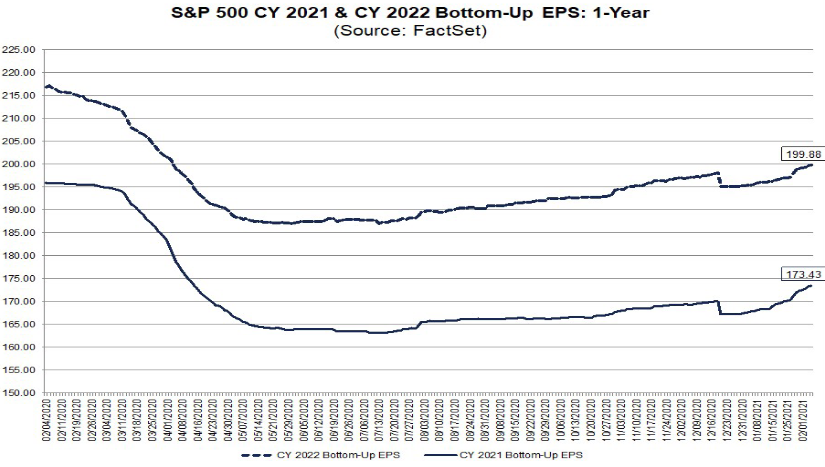
Earnings estimates continue to be revised upward on a weekly basis.
Now onto the shorter term view for the General Market:
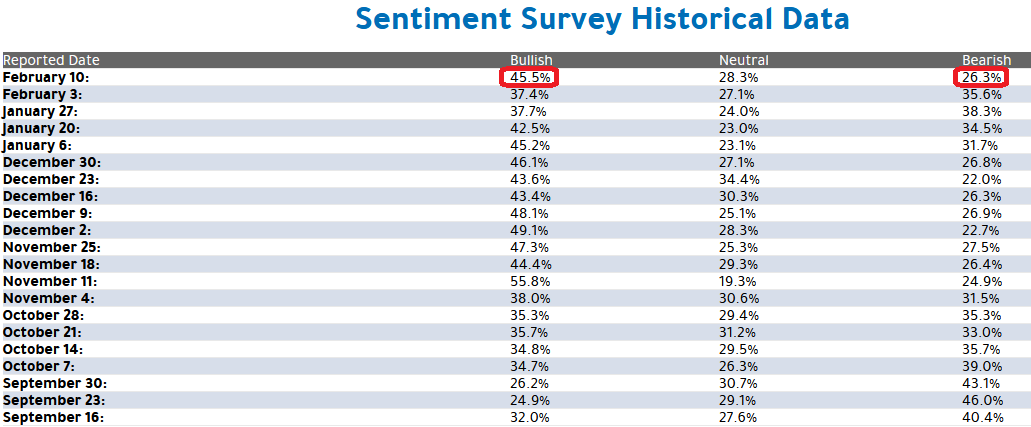
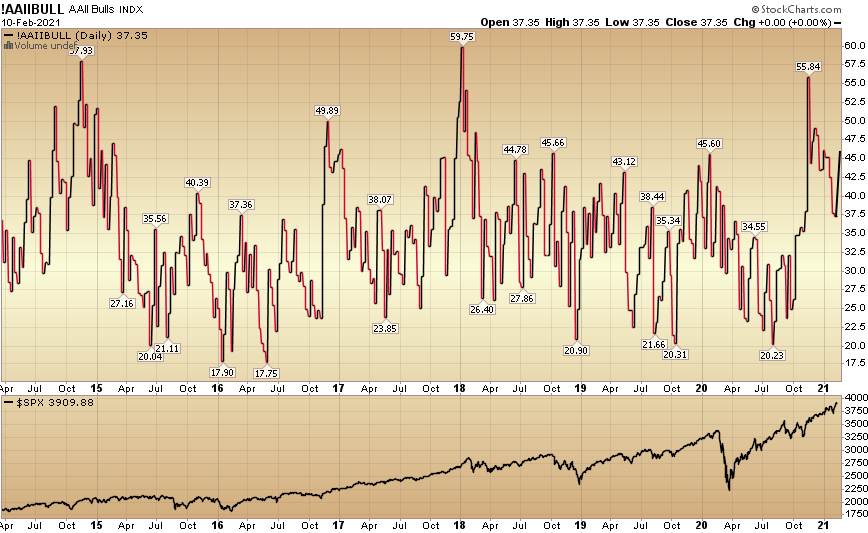
In this week’s AAII Sentiment Survey result, Bullish Percent (Video Explanation) jumped to 45.5% from 37.4% last week. Bearish Percent dropped to 26.3% from 35.6% last week. Retail exuberance is back.
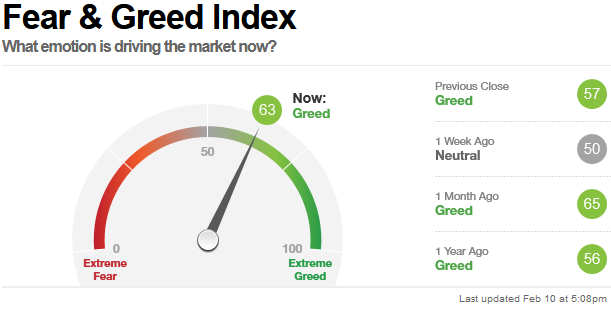
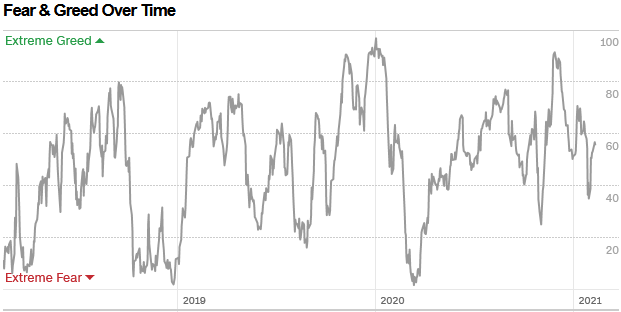
The CNN “Fear and Greed” Index rose from 55 last week to 63 this week. This is a neutral read. You can learn how this indicator is calculated and how it works here: (Video Explanation)
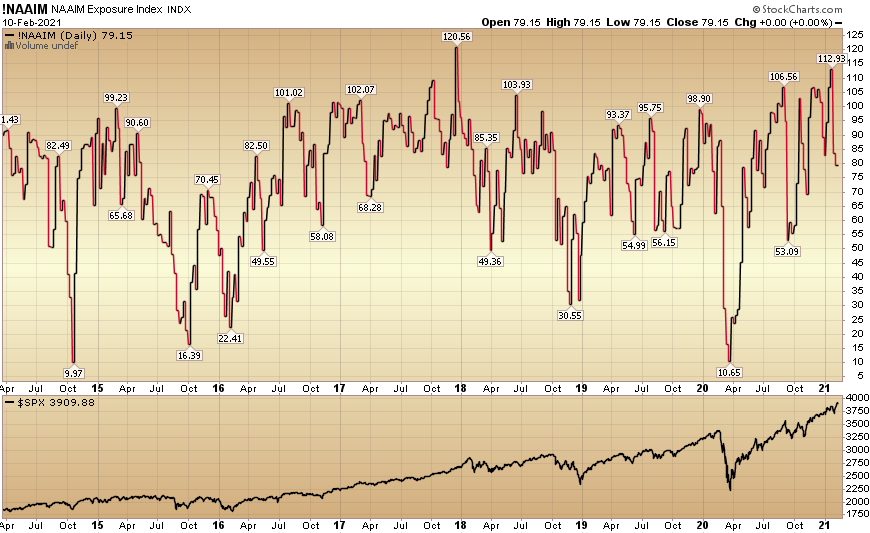
And finally, this week the NAAIM (National Association of Active Investment Managers Index) (Video Explanation) dropped to 79.15% this week from 83.51% equity exposure last week.
Our message for this week:
We will continue add to Defense & Aerospace on any weakness (on the 2H Commercial Aviation recovery thesis), and hold Banks and Energy – as we have a much lower basis in these groups.
Disclaimer: Not investment advice. For educational purposes only: Learn more at HedgeFundTips.com.
less

