
The Future Thru Commitment Of Traders This Week
Following futures positions of non-commercials are as of August 31, 2021.
10-year note: Currently net short 29.8k, up 143.1k.
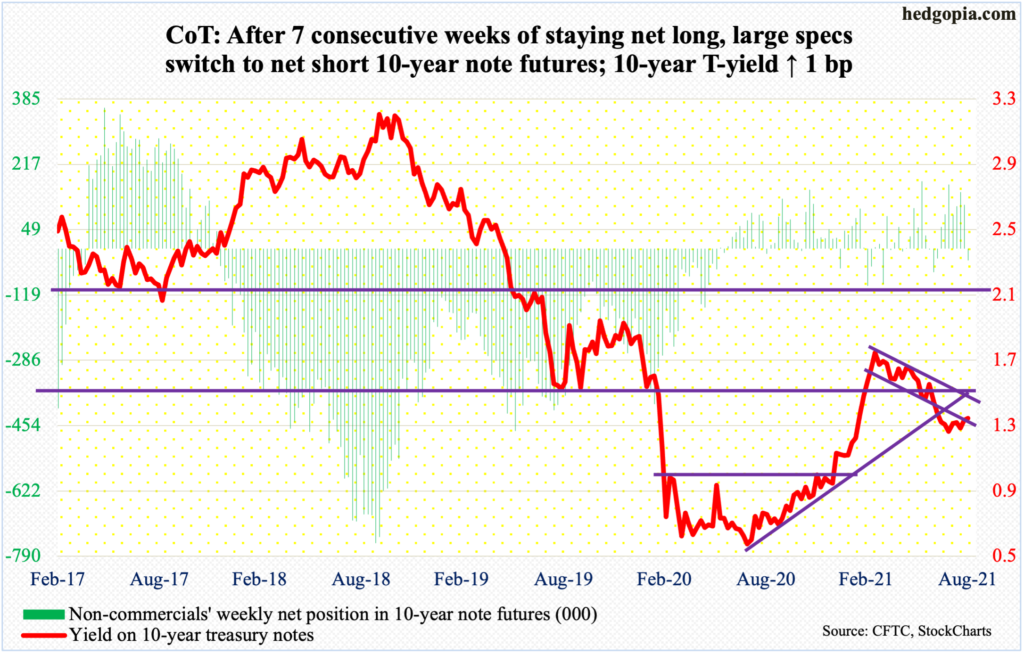
Twice in August, the 10-year treasury yield retreated after ticking 1.38 percent. This was just before testing broken-support-turned-resistance at low-1.40s. Back in February last year, this level was breached, and the rates came crashing down until they bottomed at 0.40 percent in March. The rally that followed peaked at 1.77 percent in March this year, preceded by a breakout at one percent in January. In July and August, that level was just about tested as the 10-year (1.32 percent) dropped to 1.13 percent before rallying.
Inability to test the low-1.40s resistance during the most recent run speaks of the struggle bond bears are going through. This is coming at a time when the US economy is firing on all cylinders and inflation is perking up.
Yes, the Federal Reserve continues to spend up to $80 billion a month in purchases of treasury notes and bonds. But at the same time, Chair Jerome Powell indicated at Jackson Hole last week that the central bank is getting ready to taper by the end of the year. Ordinarily – and simplistically – more supply of these securities should result in higher yields. But either these bond traders are not convinced tapering would begin in earnest later this year or they are pricing in serious growth deceleration in the economy.
The Labor Department announced Friday that August produced much-weaker-than-expected 235,000 non-farm jobs, versus expectations of 720,000; July added 1.05 million. In the meantime, home inventory is beginning to rise from very suppressed levels. If this continues, this could help ease off the prevailing rapidly accelerating prices, which in due course could adversely impact consumer sentiment/spending (more on this here).
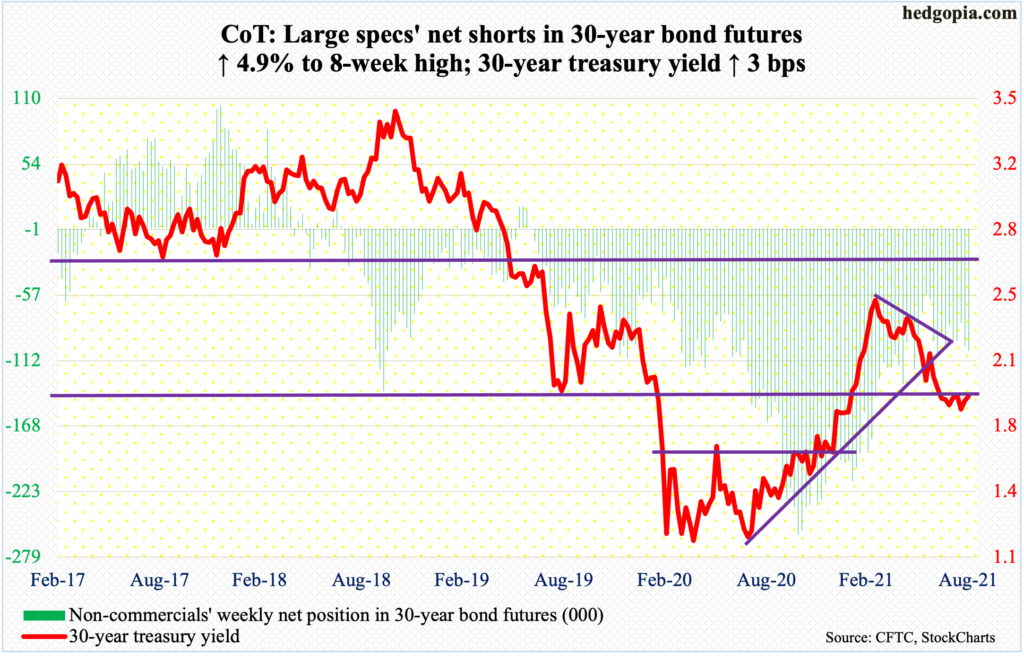
30-year bond: Currently net short 104.2k, up 4.9k.
Major economic releases for next week are as follows. Markets are closed Monday for observance of Labor Day.
Non-farm job openings (JOLTs, July) are due out on Wednesday. In June, openings jumped 590,000 month-over-month to 10.1 million – a new record.
Friday brings the producer price index (August). In July, producer prices jumped one percent m/m and 7.8 percent year-over-year. At the core level, prices increased one percent m/m in July and 6.2 percent in the 12 months to July.
WTI crude oil: Currently net long 362k, down 15.1k.
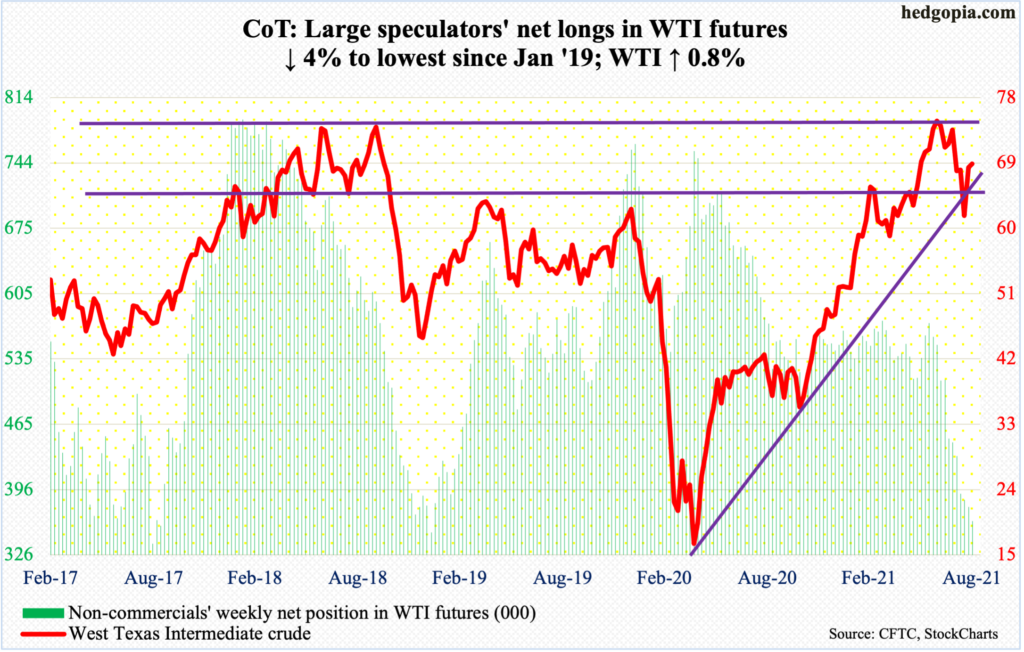
A falling trend line from July 6 when West Texas Intermediate crude ($69.29/barrel) reversed lower after ticking $76.98 was unsuccessfully tested on Thursday; the session high of $70.61 also reclaimed the 50-day moving average ($70.22) intraday but was lost by close. In October 2018, WTI peaked at $76.90. The July 6 high has the potential to be a double top – until proven otherwise.
Encouragingly for oil bulls, support at $66-$67 drew bids on Wednesday, leading to Thursday’s two-percent rally.
That said, the daily looks to be wanting to head lower. Bears will get traction once $66-$67 falls.
In the meantime, US crude production in the week to August 27 rose 100,000 barrels per day to 11.5 million b/d. Crude imports increased as well, up 183,000 b/d to 6.3 mb/d. As did gasoline stocks, which were up 1.3 million barrels to 227.2 million barrels. Crude and distillate stocks, however, fell – respectively down 7.2 million barrels and 1.7 million barrels to 425.4 million barrels and 136.7 million barrels. Refinery utilization declined 1.1 percentage points to 91.3 percent.
E-mini S&P 500: Currently net short 28.7k, up 43.6k.
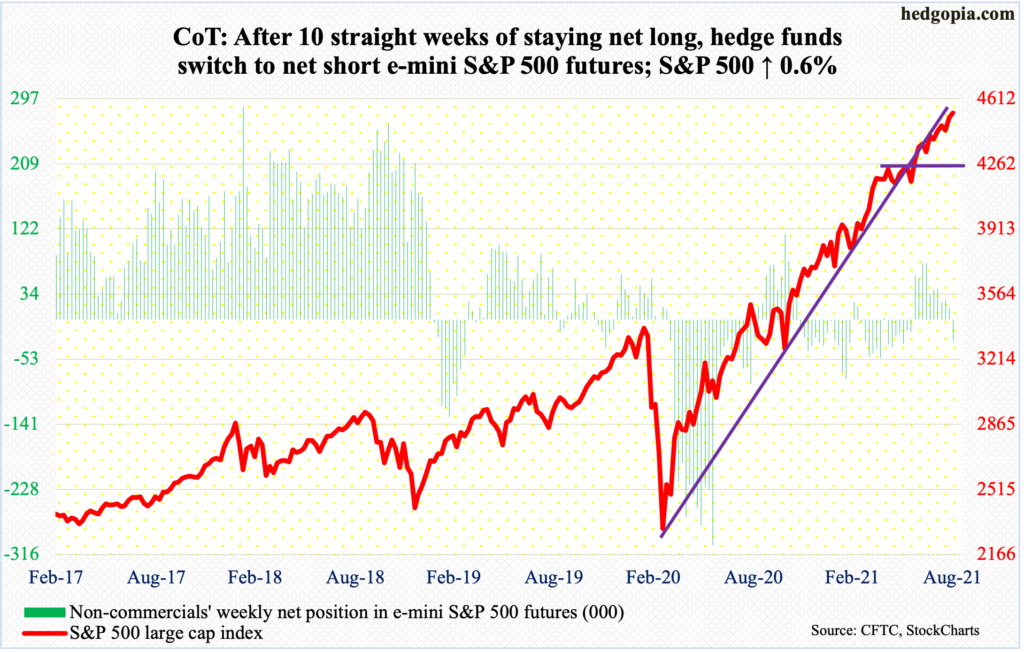
On the back of healthy inflows, the S&P 500 continued to trudge higher, to ever new highs.
In the week to Wednesday, US-based equity funds gained $12.7 billion (courtesy of Lipper). In the same week, SPY (SPDR S&P 500 ETF), VOO (Vanguard S&P 500 ETF) and IVV (iShares Core S&P 500 ETF) took in $9 billion (courtesy of ETF.com).
Since the large cap index successfully tested its 50-day on August 19 through Thursday’s fresh all-time high of 4546, it already rallied four percent. This was the 10th defense of the average from May last year. Bears need to wrestle it back to gain any traction.
This week, the index (4535) rallied 0.6 percent, with some subtle signs of distribution. Both Thursday and Friday produced dojis, and Thursday’s record high kissed the daily upper Bollinger band. The lower band is 3.1 percent lower. This approximates the 50-day at 4408.
Euro: Currently net long 10.5k, down 14.2k.
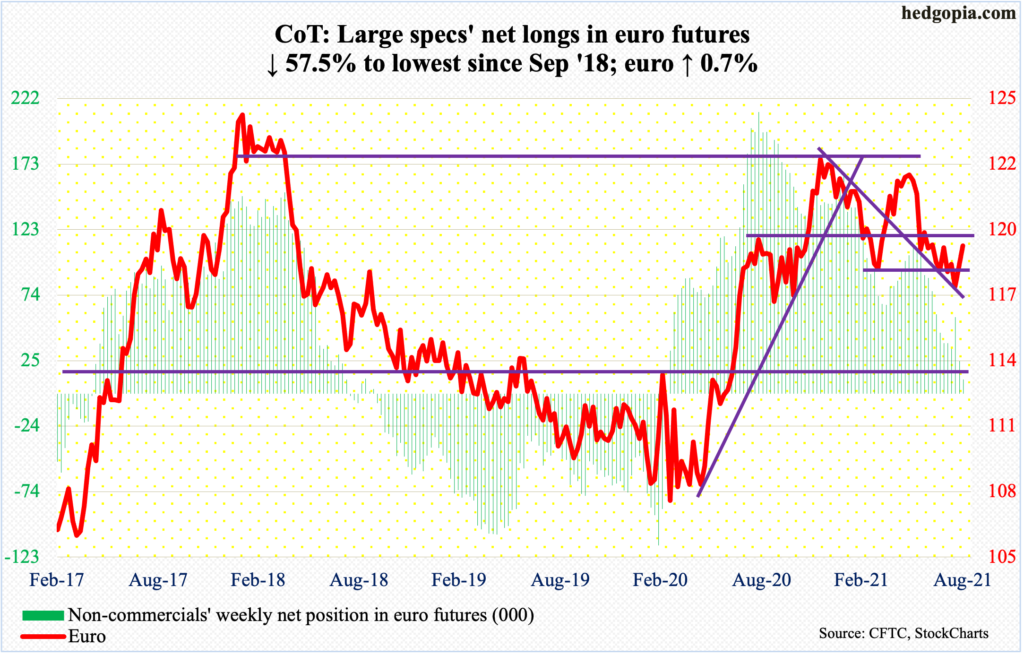
Last week, the euro ($1.1879) closed right on a falling trend line from May 25 when it retreated after ticking $1.2268. The resistance cracked this week. As did the 50-day ($1.1809), which is now flattish.
Right above lies crucial resistance at $1.19-$1.20, which has proven to be an important level going back more than 18 years. The 200-day at $1.20 lies right there. This roadblock is unlikely to yield at this try.
The daily is getting overbought. In fact, Friday’s high of $1.1909 was sold, leaving behind a large upper shadow.
Gold: Currently net long 216.6k, up 5.9k.
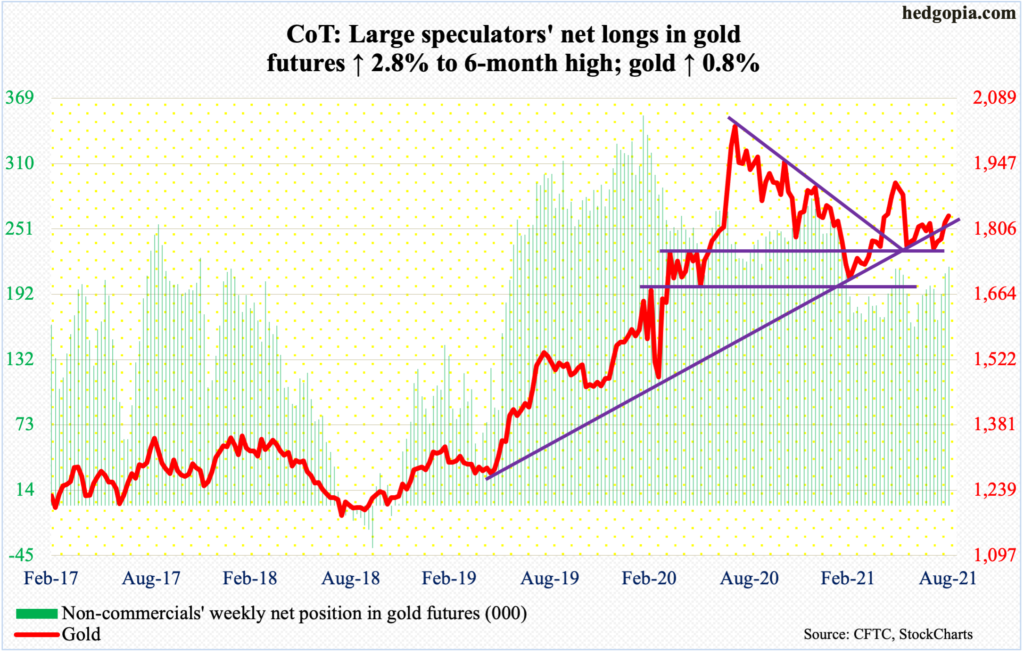
Fund flows are refusing to cooperate. In the week to Wednesday, GLD (SPDR Gold ETF) bled another $84 million (courtesy of ETF.com). This makes up nine out of the last 10 weeks of outflows during which $2.6 billion was withdrawn. During the same period, $511 million came out of IAU (iShares Gold Trust).
But non-commercials are adding to net longs, which rose to a six-month high.
Gold ($1,833.70/ounce) rallied 0.8 percent this week, for a fourth straight positive week. After straddling the 200-day for nearly two weeks, it decisively rallied past the average ($1,811) on Friday, closing right on $1,830s resistance.
Gold bugs eventually would like to go test $1,920s at some point. This is an important level as way back in September 2011 the metal peaked at $1,924. In July last year, that high was surpassed, but only to soon peak in August at $2,089. Most recently, the resistance was unsuccessfully tested several times in June this year.
Nasdaq 100 index (mini): Currently net short 2.4k, up 31.
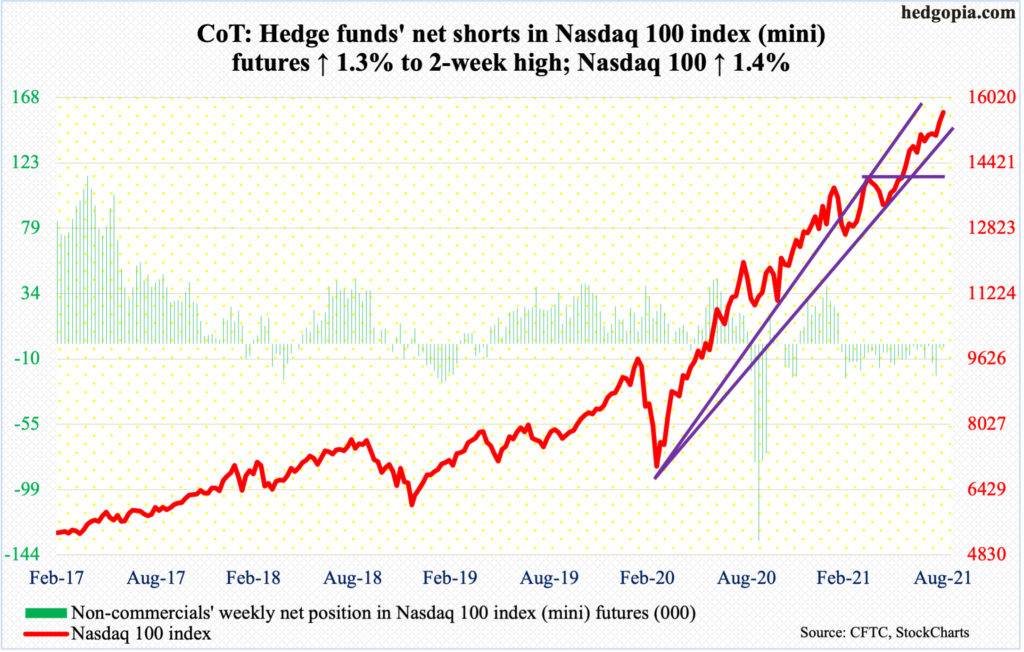
Post-15100s breakout two weeks ago, tech bulls enjoyed a back-to-back positive week. The Nasdaq 100 (15653) this week was up 1.4 percent, with a fresh intraday high of 15696 on Wednesday.
Momentum is so strong that on the monthly the RSI is over 82. That said, several times in the past, such readings are overbought enough to cause an unwinding during which the Nasdaq index comes under pressure.
Should things evolve this way in the sessions ahead, 15100s is the one to watch for now.
Russell 2000 mini-index: Currently net short 66.8k, down 6.1k.
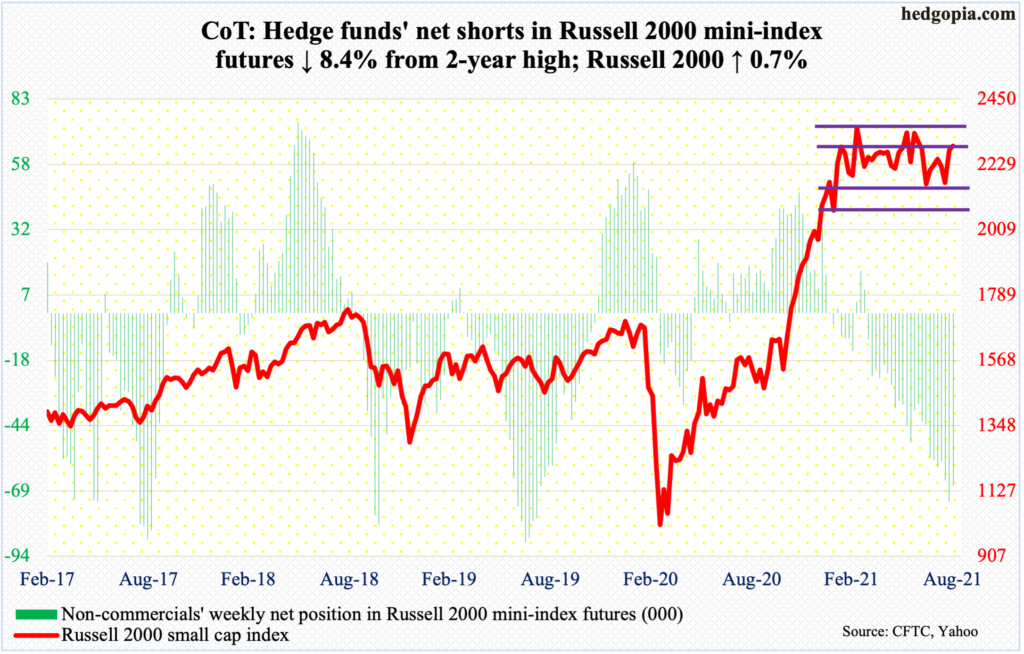
After last week’s massive 5.1-percent rally, the Russell 2000 managed to push through resistance at 2280s, albeit rater feebly, ticking 2310 intraday Thursday but closing out the week at 2292, up 0.7 percent for the week.
Shorts must be struggling to decide if they should begin to cover or stay put. As of Tuesday last week, non-commercials were sitting on net shorts in Russell 2000 mini-index futures that were at a two-year high. This week, they reduced their holdings slightly.
It is possible they are in a wait-and-see mode to find out what happens at 2350s, which comprises the upper bound of a rectangle that is nearly six months old. The lower bound lies at 2080s, which was just about tested on August 19-20.
A decisive box breakout has the potential to squeeze out the shorts (more on this here). Right here and now, it is bulls’ ball to lose.
US Dollar Index: Currently net long 20.7k, up 328.
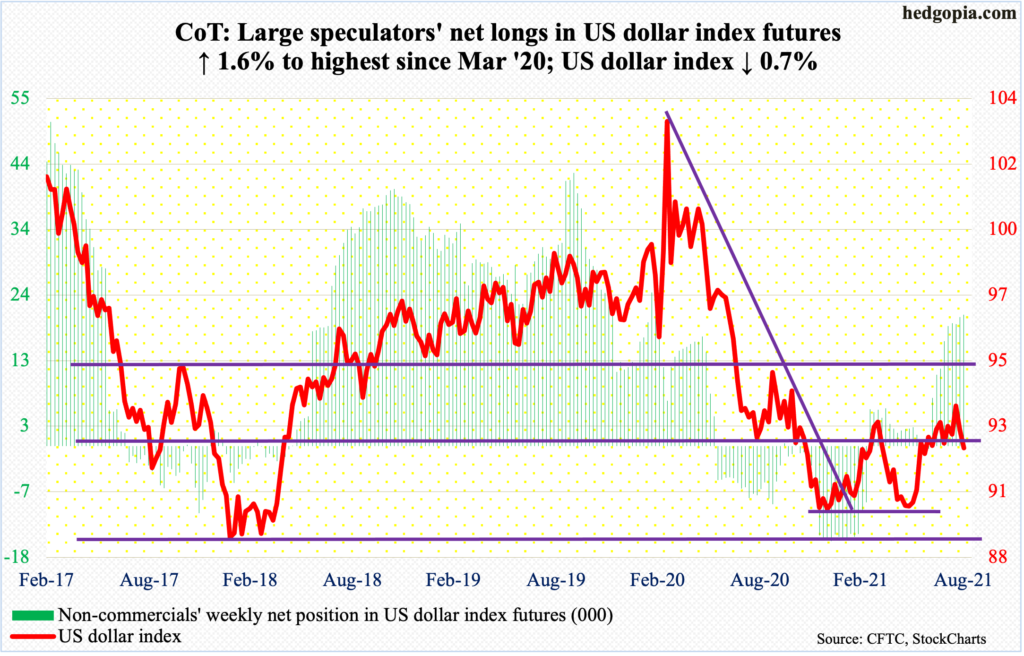
The US dollar index (92.03) is in the midst of an important test of support just north of 92, which goes back to June 2003.
This week, as soon as the week got underway, a rising trend line from May 25 was compromised. Come Wednesday, the 50-day gave way.
The daily is beginning to get oversold. If 92-plus is lost, there is short-term support at 91.70s, a loss of which opens the door toward the 200-day at 91.37. On Friday, an intraday drop to 91.80 was bought.
VIX: Currently net short 85.8k, up 12.7k.
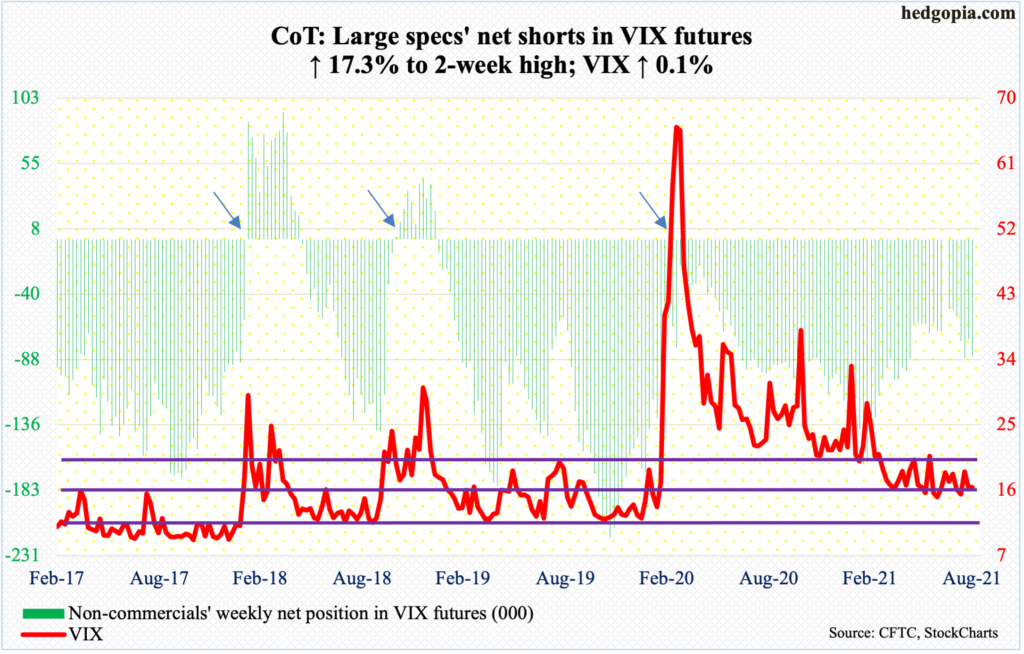
In the first four sessions, VIX (16.41) fell below 16 intraday but only to rally to close above that threshold, with a spinning top on both Wednesday and Thursday, and arguably on Friday as well. All these three sessions found support at a rising trend line from June 29 when the volatility index ticked 14.10.
On the daily, conditions are ripe for a rally. Once the 50-day (17.32) is overcome, there is not a whole lot of resistance until the 200-day, which at 20.11 approximates straight-line resistance at low-20s.
This week, VIX inched up 0.1 percent, never mind the S&P 500 had an up week. This is a rare occurrence, as ordinarily the two go in the opposite direction.
Longer term, the monthly has plenty of room to rally.
Disclaimer: This article is not intended to be, nor shall it be construed as investment advice. Neither the information nor any opinion expressed here constitutes an offer to buy or sell any ...
more

