
The “Future” Of Retirement Planning
When we decide how much money we can spend in the present year of retirement we need to know not only how much spendable wealth we have today but our best guess of how much we will have in the future. Likewise, on the expense side of the ledger, we need to know not only what our expenses were last year but also our best guess of what our expenses will be in the future. We can spend less this year, for example, if we know there is a big expense looming in the future and more if we’re pretty sure we’ll have more money in the future, say a sizable inheritance.
In short, we need a model of our retirement future to properly plan for it and even to determine a safe amount to spend this year.
Of the four inputs to this model I just mentioned, only one, our current wealth, is fairly certain.
If our entire future income will come from annuities, pensions and Social Security retirement benefits then it's relatively predictable, too. To the extent that future income will come from investments, that income is fairly unpredictable.
Expenses are unpredictable, as well. All we know for sure is how much we spent over the past few years. We can’t even be certain of the coming year’s expenses, so they too are uncertain. Retirement spending studies have shown that spending tends to decline as we age [2,3] but it doesn’t for everyone so we can’t assume that ours will. According to David Blanchett, whether or not it declines, annual spending volatility is relatively high (unpredictable from one year to the next).
When we take spending shocks into consideration, the future spending becomes even less certain. I spent $15,000 in the past year for two HVAC systems that I expected would last at least five more years. That has a much greater impact than my cable bill going up 5%.
The primary determinant of retirement cost is longevity. A five-year retirement will be far cheaper than one of 35 years. Our individual life expectancy is completely unpredictable assuming we are healthy.
As researcher Larry Frank keeps telling me, everything in an individual household’s retirement funding is stochastic, i.e., unpredictable.
Following is a graph of 200 randomly-selected portfolio value paths from a simulation of 10,000 scenarios for a retiree with a $1M portfolio from which she plans to spend $45,000 a year. All calculations are in real dollars and life expectancies are randomized using actuarial tables. It assumes a real 5.25% expected market return with a standard deviation of 12%.
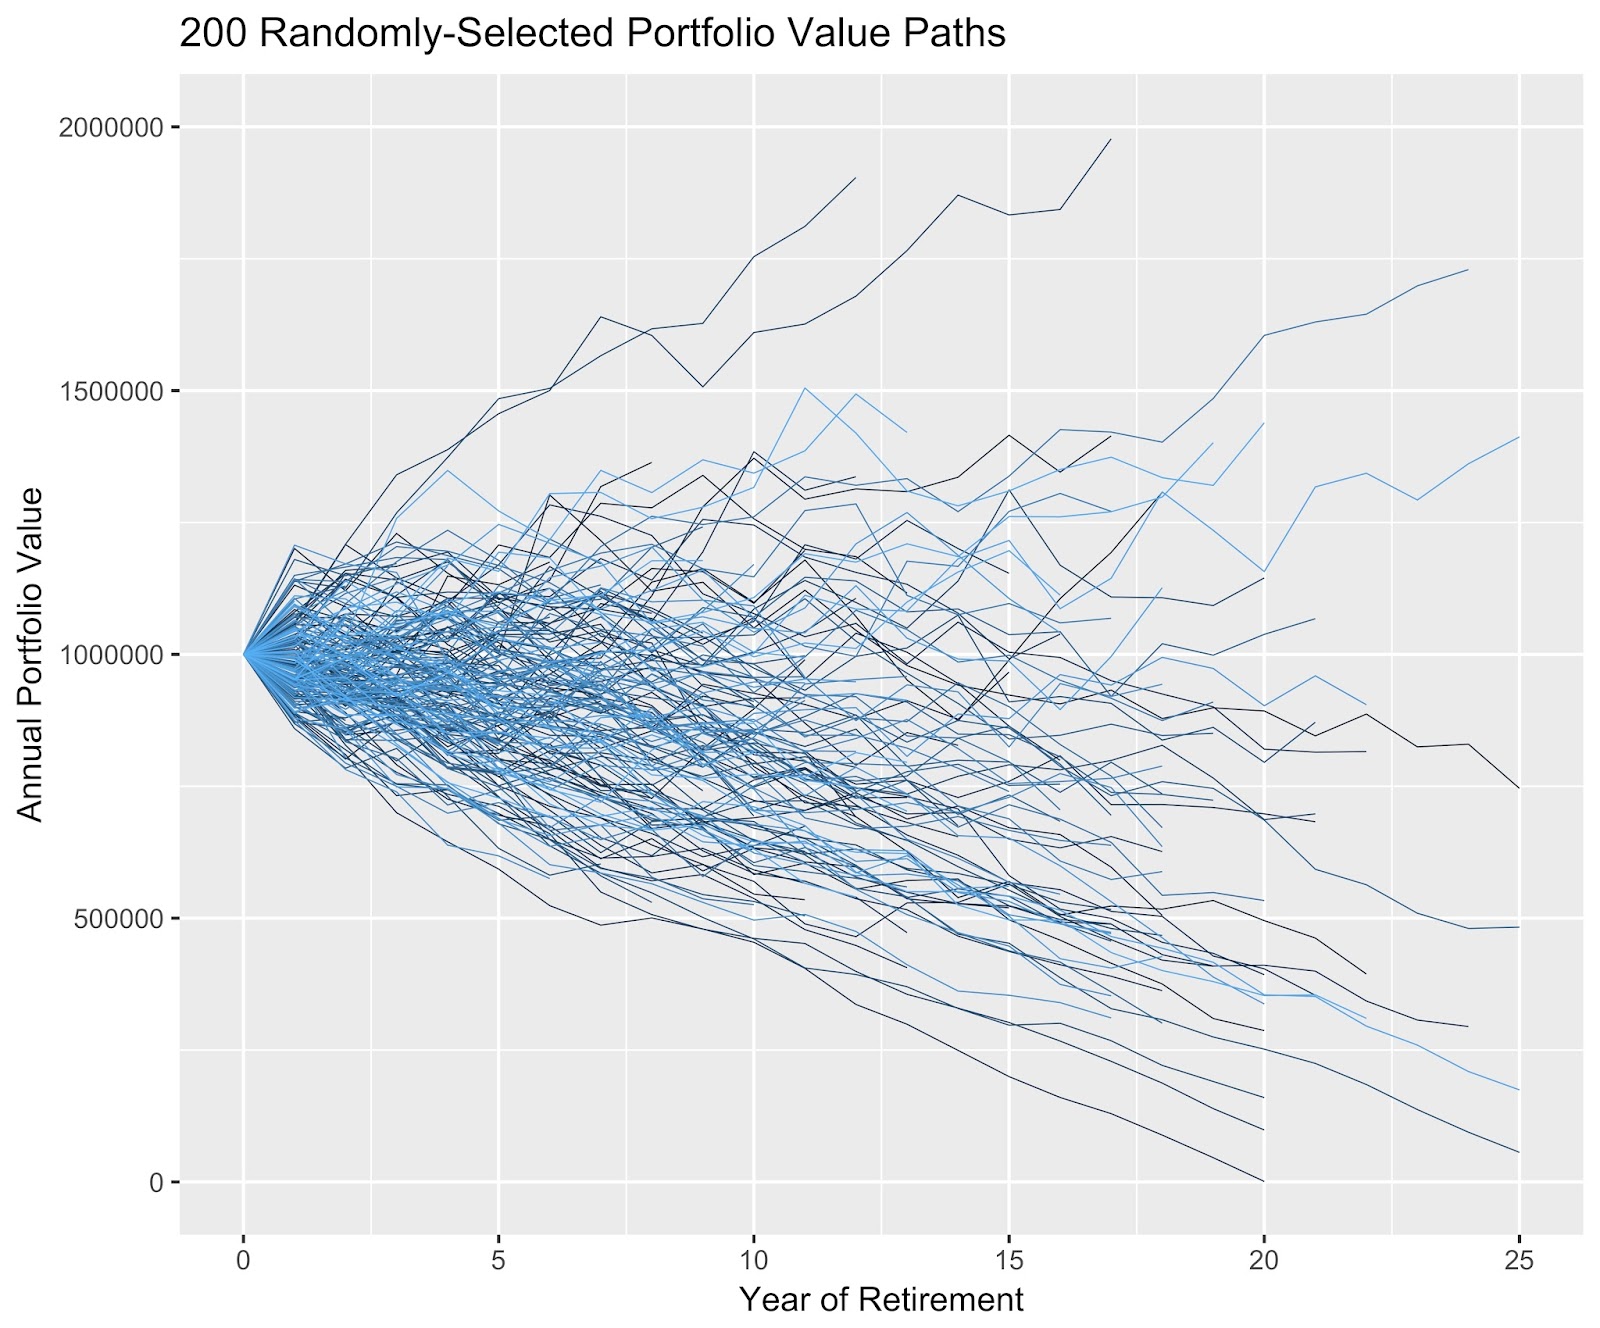
Notice that most terminal portfolio values end up lower than the initial $1M portfolio value in real dollars. In this simulation, the median terminal portfolio value was about $860,000. About 75% of the scenarios ended with smaller portfolio values than the $1M they started with. This is typical of simulation results, though spending less would shift the bulk of those blue lines upward and spending more would do the opposite. The central mass of those blue lines would rotate around the starting point like clock hands, farther clockwise with more spending.
I read a comment on a retirement blog this week from a reader who said, “Retirement is uncertain so planning is useless.”
That’s like saying we shouldn’t plan outdoor activities because we can’t know future weather conditions with certainty. It’s like saying that companies shouldn’t bother developing business plans because they can’t know future economic conditions for sure. Of course you can plan where outcomes are uncertain and the best way to do that is with probabilities.
We develop retirement plans using models of the future but some models are much better than others. Nor is the model a plan. If we schedule a picnic for tomorrow and the weather models predict a 20% chance of rain, calculating the 20% is not the plan. The plan is deciding to take an umbrella or planning a backup activity. As in retirement planning, we use the model results to help create the plan.
Another blog suggested that Monte Carlo simulations can generate hundreds of thousands of future scenarios but that using them for planning is a mistake because a retiree can’t know which one she will experience. The first part of that statement is true. Your retirement's future finances might follow one of the blue lines in the chart above — assuming we ignore spending shocks — but it is impossible to know which one is yours.
There is a small chance that yours will follow a better path than any of these and a small chance that it will follow one worse and we can't ignore the latter's risk. (The former would just be sweet – we're OK with things turning out much better than we expected.)
Though it is true that we can't foresee our future path, it is also irrelevant — the purpose of the Monte Carlo model isn’t to predict an individual retiree’s path through the future (that’s impossible) but to explore a broad range of possible scenarios and develop some estimate of the probability of each actually being realized. Simulation is essentially a gigantic "what-if" analysis.
The weather forecasting model is likewise imperfect but the probabilities it provides are extremely useful. If there is a 5% chance of rain tomorrow perhaps we forego the umbrella. With a 95% probability or rain, we might cancel the event altogether. We don’t say, “No use planning based on the weather probabilities because we can’t know for sure.”
Determining how much you can safely spend this year requires a good model of the future.
The alternative the blogger suggested was simply to build a spreadsheet for a near-worst-case life expectancy using an expected market return and ignoring stock return variance. Ignoring variance, of course, ignores sequence of returns risk. This is the model of the future you get using a spreadsheet that assumes the same expected market return every year. It's the kind of analysis we did before Bengen. It's the kind of thinking that led Peter Lynch to suggest 7% annual spending from a stock and bond portfolio would be safe.
(When I say "spreadsheet" in this post, I'm referring to any model that assumes zero portfolio volatility and a fixed life expectancy. Actually, you can use a Monte Carlo simulator and set the portfolio volatility to zero and get the same results. On the other hand, you can build a Monte Carlo simulator with market volatility in an Excel spreadsheet – I have the scars to prove it. You can download the Mother of All Monte Carlo Spreadsheets at the Retire Early Home Page[1].)
The path to the median outcome is also in that jumble of blue lines above, so the first question we should ask the blogger is, "If you can't know which of those blue paths to choose, why did you go ahead and pick one (the one with the mean annual return), anyway?
The following chart shows all those blue paths again with the "spreadsheet" prediction of the future superimposed (red) assuming a fixed 30-year retirement and zero market return variance. That’s effectively what a spreadsheet model produces.
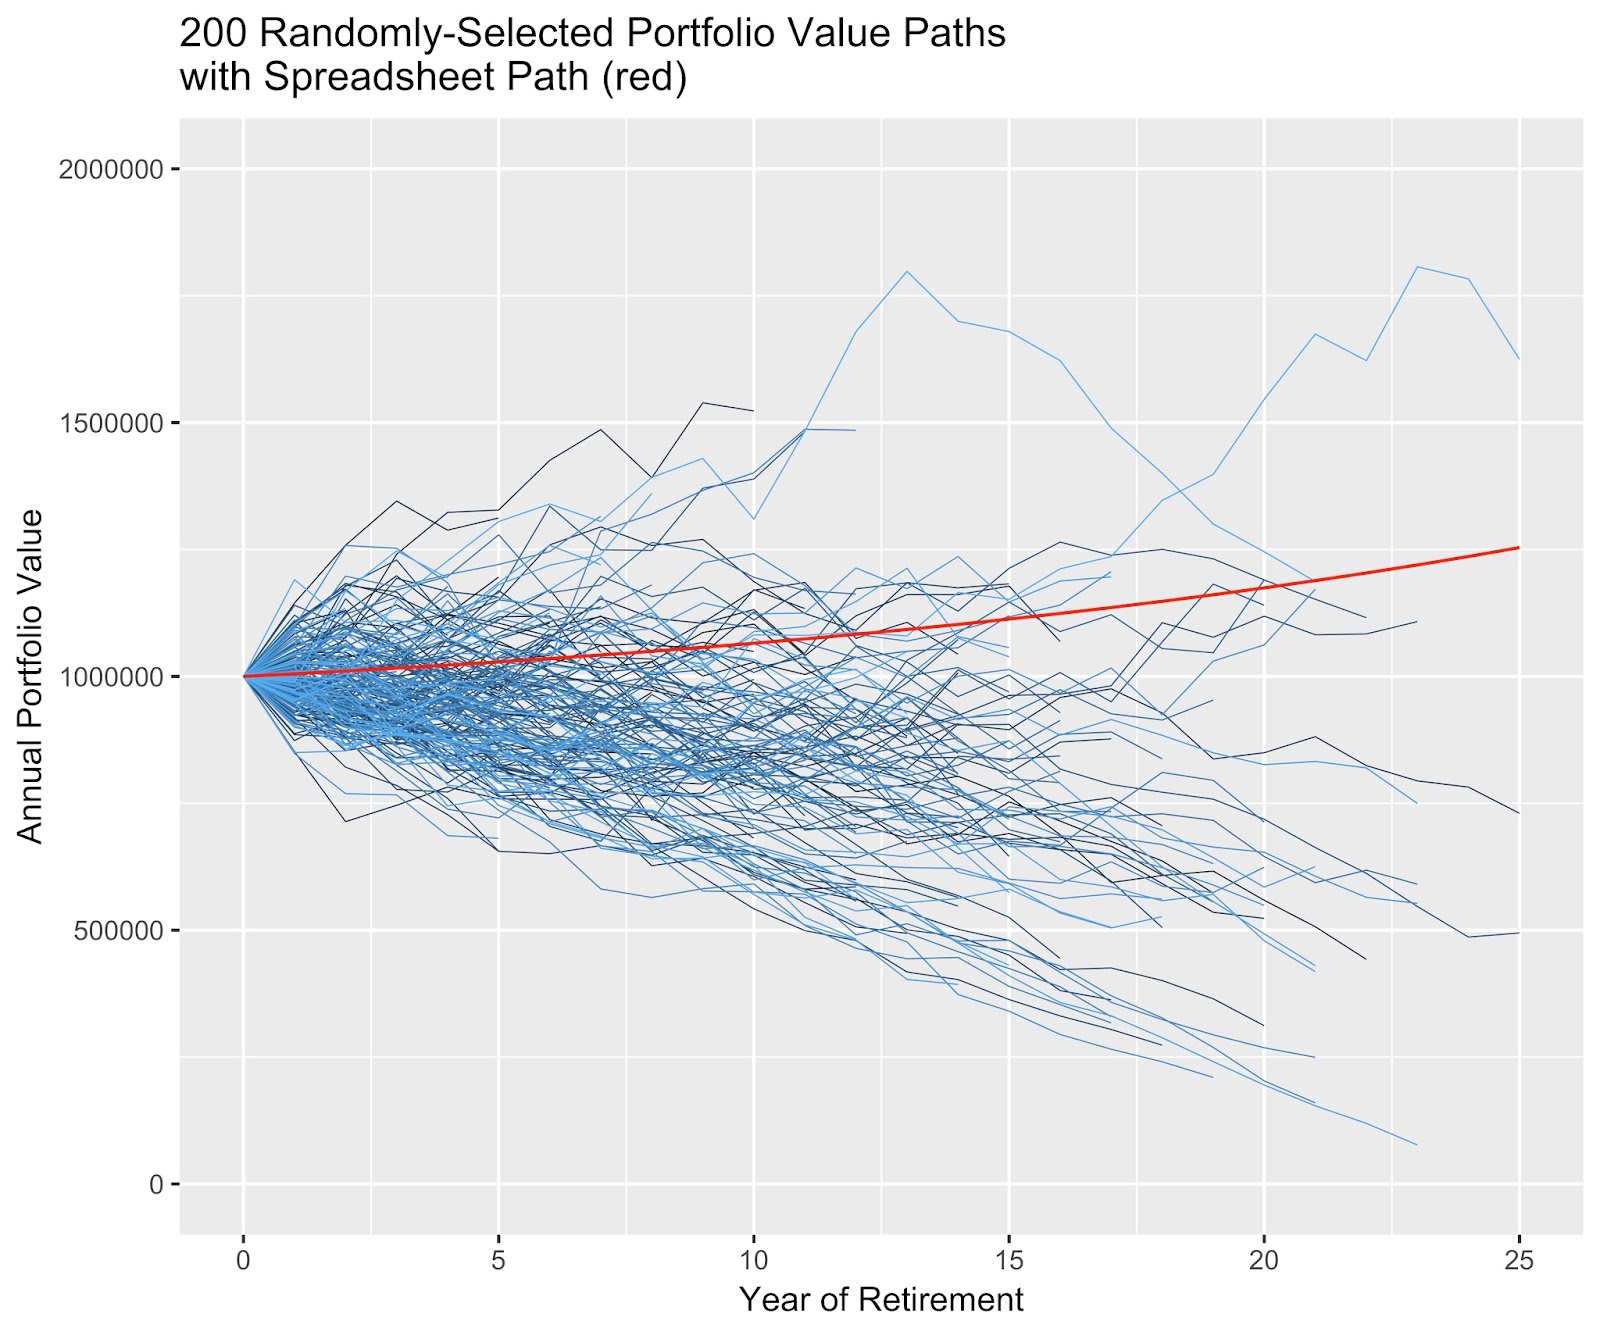
Why is the spreadsheet future a nice, smooth upward curve while all the simulated blue lines are jagged and head off in all directions including ruin?
The answer is sequence of returns risk. The spreadsheet ignores market volatility and consequently, it ignores sequence risk. The model in the simulation is much more realistic.
And why does the spreadsheet portfolio end up so large compared to most of the blue lines?
The answer is sequence risk plus longevity. Note that life expectancies are simulated to generate the blue lines (they end at different years of retirement), while the spreadsheet model assumes a fixed-length retirement of 30 years. Real-life portfolios and retirees don't often last 30 years so their portfolios most often have less time to grow
Of all the paths on this chart, the red spreadsheet path is by far the least likely for you to experience. Twenty consecutive years of identical positive portfolio returns is unimaginable.
With 10,000 simulated scenarios, fifteen survive 20 years and end up within 1% of the spreadsheet path value at 20 years. These are fifteen possible paths to reach the spreadsheet value at 20 years and they don't get there in a straight line, as you can see on the following chart. So, the spreadsheet path is in there, but why one would choose it as the representative outcome remains a mystery.

The path that reaches the median terminal portfolio value, among the 10,000 simulated scenarios, is shown on the graph above in orange. It ends at year 17, which is roughly the median life expectancy for this 65-year old. The spreadsheet path presumably uses average historical market returns, so why is its outcome at 20 years ($1.2M) so much higher than that of the median simulated outcome of $860,000?
The chart shows that using the average market return every year in a spreadsheet (the red line) doesn't produce the average outcome (the orange line). You're probably tired of hearing me say "sequence risk and stochastic life expectancies are the difference" but simulations model them and spreadsheets don't.
The spreadsheet path is quite optimistic. If you insist on a spreadsheet model, you should at least reduce the expected return to compensate for sequence risk. In this comparison, you would need to reduce the expected portfolio return in the spreadsheet model from 5.25% to 3.5% to obtain results similar to the simulation's median outcome at 20 years.
Lastly, let's look at a density histogram of all portfolios that survived at least 20 years.
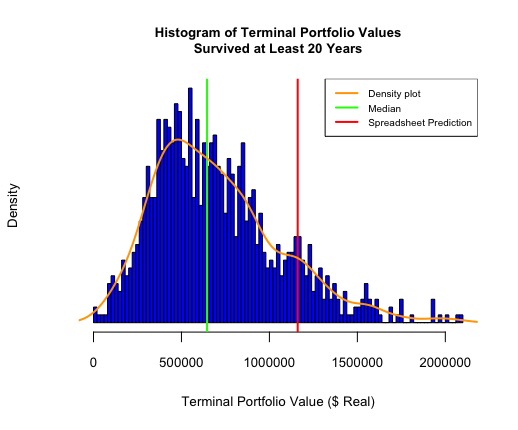
The blue bars show the portfolio values after 20 years for those 956 portfolios and retirees who survived at least that long. It's a probability density histogram, so the total area of the blue bars equals 1.
The orange curve shows the continuous density. As you can see, the distribution is right-skewed and not a symmetrical normal distribution. The median is less than the mean due to all those huge but highly improbable outcomes along the right tail.
We're more interested in the median ($645,000), the value at which half of the portfolios are larger and half smaller. About 57% of the outcomes after 20 years are less than the mean ($702,000) compared to the 50% of outcomes that are less than the median. The median is the more representative statistic with this skewed distribution.
Finally, the red vertical line represents the spreadsheet model's portfolio value after 20 years, $1.17M. At the 20-year mark, that red portfolio value is larger than 88% of the simulated portfolios that survived that long. $645,000 is a much more representative expectation after 20 years than the spreadsheet prediction.
It's true that you can't predict which of those 10,000 blue paths your future will mimic but the spreadsheet outcome is one of those. Pick it and you simply decided to pick a path from the 10,000 choices after saying you couldn't. And, then you picked a very unlikely and optimistic one. The spreadsheet predicts portfolio values in the absence of sequence and longevity risk and tells you nothing about the probability of realizing them.
Furthermore, the purpose of simulation isn't to predict your future but to explore the possibilities, so you aren't intended to choose one.
We need a model of the future to plan retirement. We need it to even calculate the safe amount to spend this year. Simulation is a good starting point.
The takeaway, for now, is that if you have planned your retirement with a spreadsheet model, you should take another look, especially if your plan shows a single straight path to doubling (or more) your initial portfolio. It could happen; it just isn't likely and if it does happen it certainly won't be a smooth path.
If you're using an online calculator, make sure it incorporates simulation. There's a Monte Carlo version of E$Planner, for example, and there are free simulators online.
But simulations have issues, too, so they're only a starting point. I'll discuss the shortfalls of simulation next time before describing how to make sense of that jumble of blue lines.
Disclosure: None.


