
The Employment Deceleration, And Business Cycle Indicators
Employment in early January continues to decelerate to a near standstill (BLS), as I suggested in November would happen if the US did not implement a coherent plan to contain the Covid-19 pandemic.
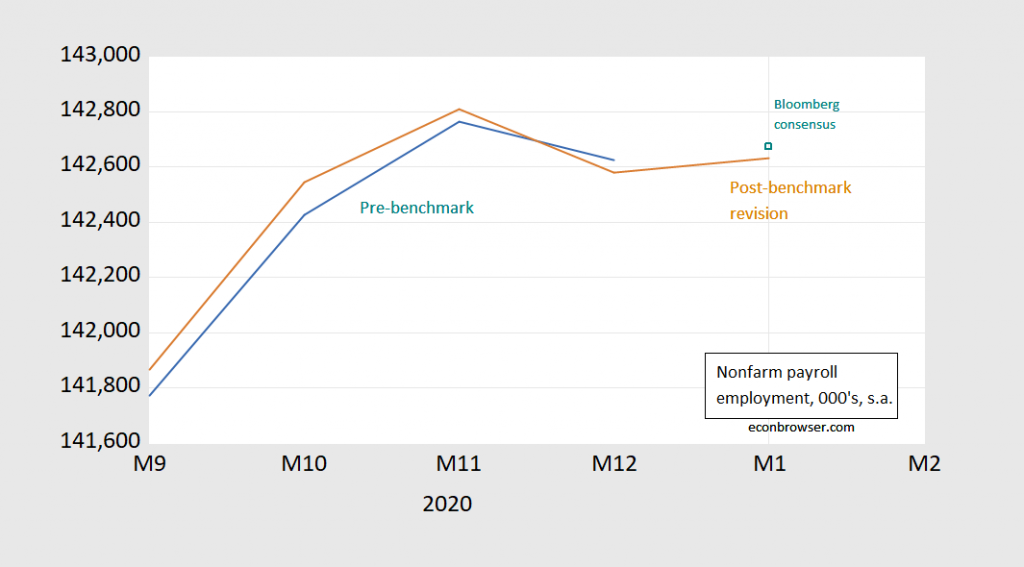
Figure 1: Nonfarm payroll employment, January release of 2/5 (brown), December release of 1/8 (teal), Bloomberg consensus for January as of 2/4, assumes no revision to December figure (teal square), all in 000’s, seasonally adjusted. February 5 release incorporates annual benchmark revisions. Source: BLS, Bloomberg accessed 2/4, and author’s calculations.
The 49,000 increase was very close to the Bloomberg consensus of 50,000, but well below for instance the Goldman Sachs (2/4) estimates of 200,000 (GS estimate of consensus as 100,000).
Notice the impact of these numbers for the snapshot of the macroeconomy.
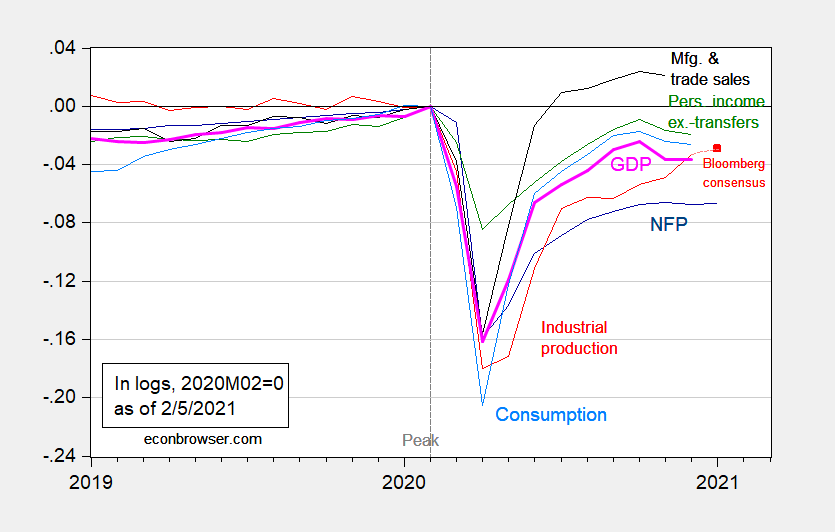
Figure 2: Nonfarm payroll employment (dark blue), industrial production (red), Bloomberg consensus for January as of 2/5 (red square), personal income excluding transfers in Ch.2012$ (green), manufacturing and trade sales in Ch.2012$ (black), consumption in Ch.2012$ (light blue), and monthly GDP in Ch.2012$ (pink), all log normalized to 2020M02=0. Source: BLS, Federal Reserve, BEA, via FRED, IHS Markit (nee Macroeconomic Advisers) (1/4/2021 2/1/2021 release), NBER, and author’s calculations.
More commentary at Calculated Risk.
Nonfarm payroll employment in January 2021 is 3 million less than that in January 2017, i.e., 2% lower (2.1% in log terms).
Disclosure: None.


