
The Climatic Run In S&P 500: Topping Pattern Or Sign Of Strength?
Was the climatic run in S&P 500 after the FOMC last week a topping pattern or a sign of strength?
Watch the video below to find out how to use the Wyckoff method with volume spread analysis to interpret the price action, the key levels to validate the bullish scenario, and the target price for S&P 500.
Video Length: 00:07:58
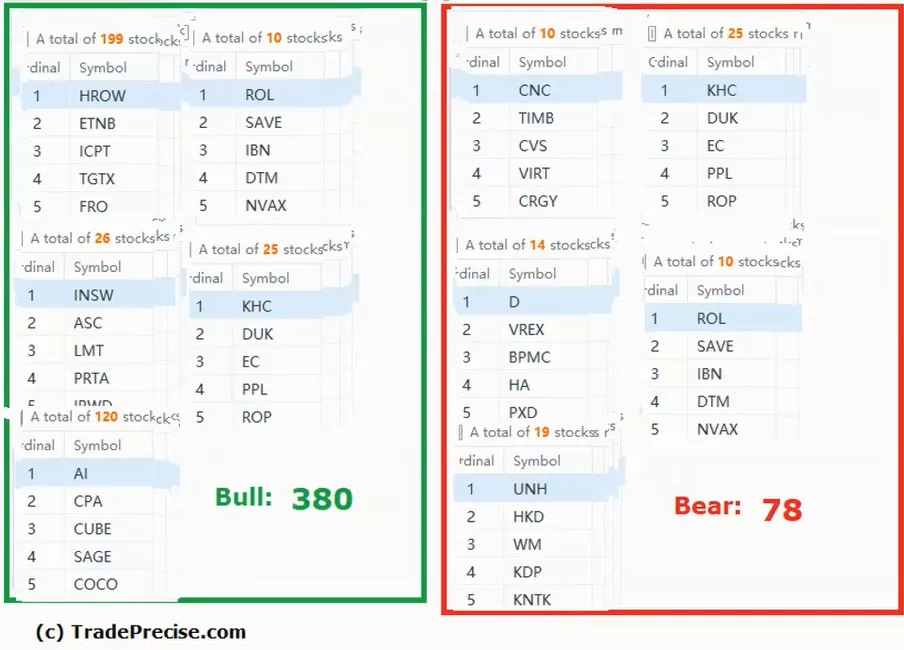
The bullish setup vs. the bearish setup is 380 to 78 from the screenshot of my stock screener below suggested a positive market environment.
Watch out for a successful test as discussed in the video above before the next rally up.
It is better to wait for a pullback for entry setup rather than chasing the extended run for some outperforming stocks as discussed in the live session.
More By This Author:
Morgan Stanley's Downturn Is Over: Is It Time To Jump In?
Ready For The Qualcomm Bull Run In 2023? Here's What To Expect
The Rise Of Oracle: How It's Defying Market Trends
Disclaimer: The information in this presentation is solely for educational purpose and should not be taken as investment advice.


