
The Big Four - Industrial Production: Increase In November
Official recession calls are the responsibility of the NBER Business Cycle Dating Committee, which is understandably vague about the specific indicators on which they base their decisions. This committee statement is about as close as they get to identifying their method.
There is, however, a general belief that there are four big indicators that the committee weighs heavily in their cycle identification process. They are:
- Nonfarm Employment
- Industrial Production
- Real Retail Sales
- Real Personal Income (excluding Transfer Receipts)
The Latest Indicator Data
Today's report on Industrial Production for November shows a 0.39% increase month-over-month, which was slightly above the Investing.com consensus of 0.3%. The year-over-year change is -5.50%, down from last month's YoY increase.
Here is the overview from the Federal Reserve:
Industrial production increased 0.4 percent in November. After having fallen 16.5 percent between February and April, the level of the index has risen to about 5 percent below its pre-pandemic (February) reading. In November, manufacturing output advanced 0.8 percent for its seventh consecutive monthly gain. An increase of 5.3 percent for motor vehicles and parts contributed significantly to the gain in factory production; excluding motor vehicles and parts, manufacturing output moved up 0.4 percent. The output of utilities declined 4.3 percent, as warmer-than-usual temperatures reduced the demand for heating. Mining production increased 2.3 percent after decreasing 0.7 percent in October.
At 104.0 percent of its 2012 average, total industrial production was 5.5 percent lower in November than it was a year earlier. Capacity utilization for the industrial sector increased 0.3 percentage point in November to 73.3 percent, a rate that is 6.5 percentage points below its long-run (1972–2019) average but 9.1 percentage points above its low in April. [view full report]
The chart below shows the year-over-year percent change in Industrial Production since the series inception in 1919, the current level is lower than at the onset of all 17 recessions over this time frame of nearly a century.

Capacity Utilization
The Fed's monthly Industrial Production estimate is accompanied by another closely watched indicator, Capacity Utilization, which is the percentage of US total production capacity being used (available resources includes manufacturing, mining, and electric and gas utilities). In addition to showing cycles of economic growth and demand, Capacity Utilization also serves as a leading indicator of inflation.
Here is a chart of the complete Capacity Utilization series, which the Fed began tracking in 1967. The linear regression assists our understanding of the long-term trend. We've highlighted the post-recession peak in November 2018.

The latest reading is well below its interim peak and the regression.
The Generic Big Four
The chart and table below illustrate the performance of the generic Big Four with an overlay of a simple average of the four since the end of the Great Recession. The data points show the cumulative percent change from a zero starting point for June 2009. We will update this chart and table to reflect the current recession when a real trough is confirmed (there may be more in store).

Assessment and Outlook
Here is a percent-off-high chart based on an average of the Big Four. The average of the four set a new all-time high in November. April is looking to be the worst month for the Big Four in terms of the equal-weighted aggregate since 2013. In terms of percent-off highs, this is the Big Four's worst in its history.

The next update of the Big Four will be the latest numbers for real retail sales, out tomorrow.
Background Analysis: The Big Four Indicators and Recessions
The charts above don't show us the individual behavior of the Big Four leading up to the 2007 recession. To achieve that goal, we've plotted the same data using a "percent off high" technique. In other words, we show successive new highs as zero and the cumulative percent declines of months that aren't new highs. The advantage of this approach is that it helps us visualize declines more clearly and to compare the depth of declines for each indicator and across time (e.g., the short 2001 recession versus the Great Recession). Here is our four-pack showing the indicators with this technique.


The chart above is an excellent starting point for evaluating the relevance of the four indicators in the context of two very different recessions. In both cases, the bounce in Industrial Production matches the NBER trough while Employment and Personal Incomes lagged in their respective reversals.
As for the start of these two 21st century recessions, the indicator declines are less uniform in their behavior. We can see, however, that Employment and Personal Income were laggards in the declines.
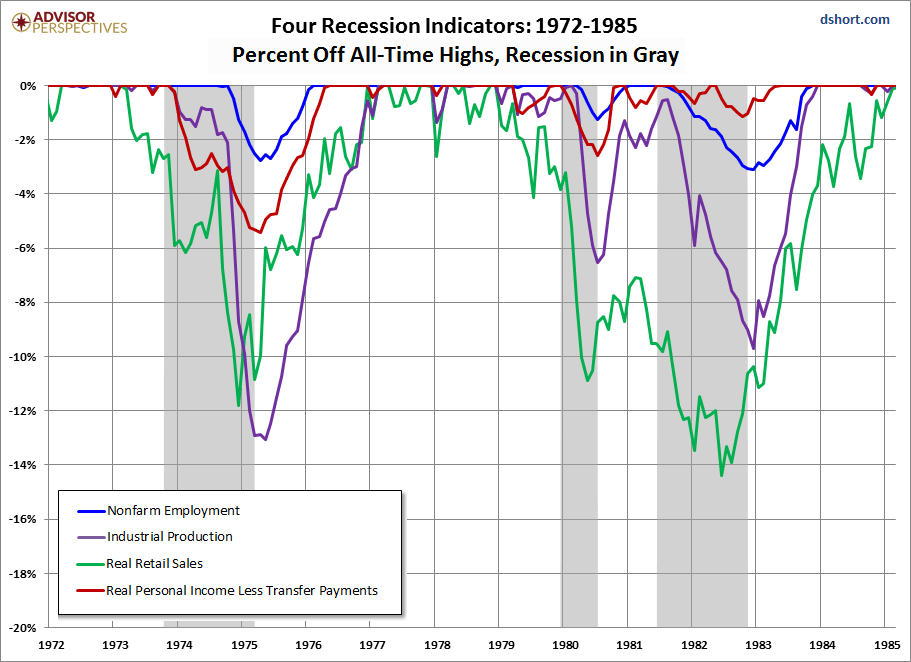
Now let's look at the 1972-1985 period, which included three recessions -- the savage 16-month Oil Embargo recession of 1973-1975 and the double dip of 1980 and 1981-1982 (6-months and 16-months, respectively).
And finally, for sharp-eyed readers who can don't mind squinting at a lot of data, here's a cluttered chart from 1959 to the present. That is the earliest date for which all four indicators are available. The main lesson of this chart is the diverse patterns and volatility across time for these indicators. For example, retail sales and industrial production are far more volatile than employment and income.

The charts above focus on the Big Four individually, either separately or overlaid. Now let's take a quick look at an aggregate of the four. The next chart is an index created by equally weighting the four and indexing them to 100 for the January 1959 start date. We've used a log scale to give an accurate indication of growth and also added an exponential regression to assist us in seeing the secular patterns of faster and slower growth. As we can readily see, growth of this aggregate indicator has slowed dramatically since the end of the last recession.
Disclosure: None.


