
Tesla Stock Chart Target: See The Trade
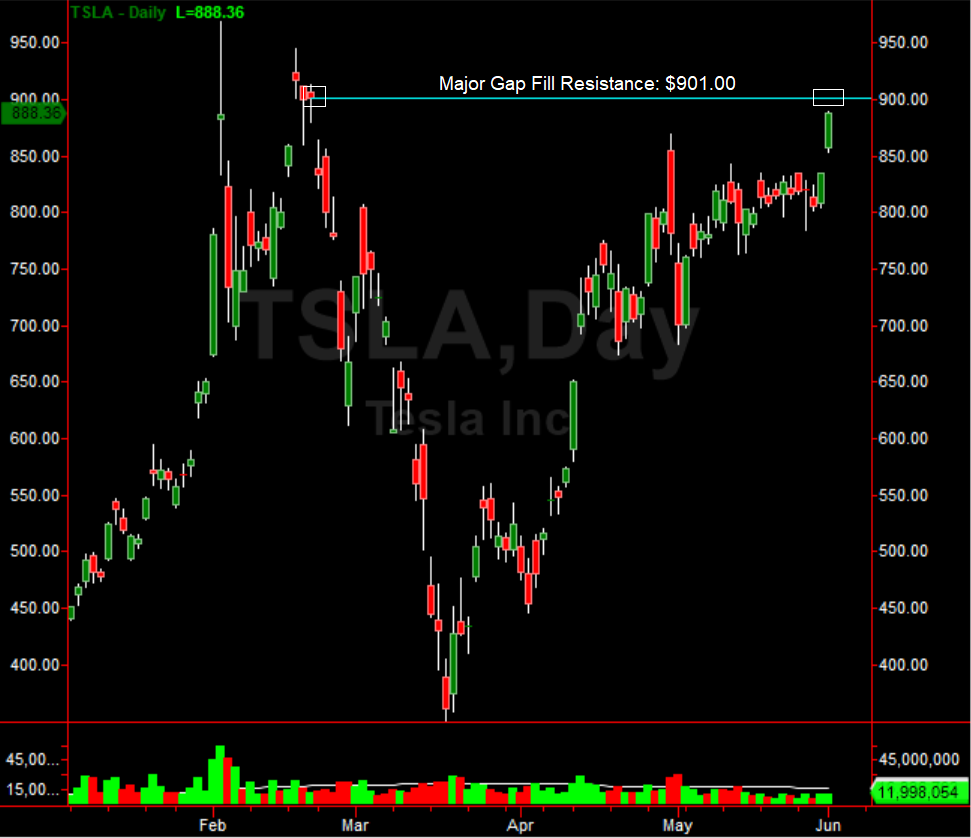
Tesla Inc (TSLA) surged higher after the successful SpaceX launch over the weekend. The stock is now up well over 100% since the March 2020 lows and investors are piling on one more time. The last time they piled on, the stock hit $970, then fell to $350 within a month. As a chart technician, I look for major levels of resistance when a stock gets too extended in the near-term. In Tesla’s case, a run from $350 to nearly $900 in 10 weeks is overdone. The Tesla stock chart target is $901.00. This is a technical gap fill level and major resistance. Look for this technical target to be achieved by tomorrow.
Once the Tesla stock chart target of $901.00 is achieved, it becomes a major short trade for a pullback to $650.00. The market has an amazing way of ignoring reality and loving hype. Even Elon Musk has said his stock was over-priced but investors have ignored his comments. I expect the drop to $650 to happen within 2 months. Have a wonderful day and continue to profit!
(Click on image to enlarge)
Disclosure: None.


