
Stock Exchange: Climbing The Wall Of Worry - July 4, 2019
The Stock Exchange is all about trading. Each week, we do the following:
- Discuss an important issue for traders;
- Highlight several technical trading methods, including current ideas;
- Feature advice from top traders and writers; and
- Provide a few (minority) reactions from fundamental analysts.
We also have some fun. We welcome comments, links and ideas to help us improve this resource for traders. If you have some ideas, please join in!
Review: Are You Missing The Big Picture?
Our previous Stock Exchange asked the question: Are You Missing The Big Picture? We noted that with trading, it’s easy to get lost in the minutiae. Specifically, traders often get so caught up in the details of the day-to-day that they lose sight of the big picture.
This Week: Climbing The Wall Of Worry
Despite a non-stop flow fear mongering from the media, the market continues to climb the wall of worry. For example, we just hit fresh all time highs in the S&P 500, and we just completed the best first half of the year in many years. Charlie Bilello does a good job of summing up the market’s strength in his recent tweet citing lots of strong data points, as follows:
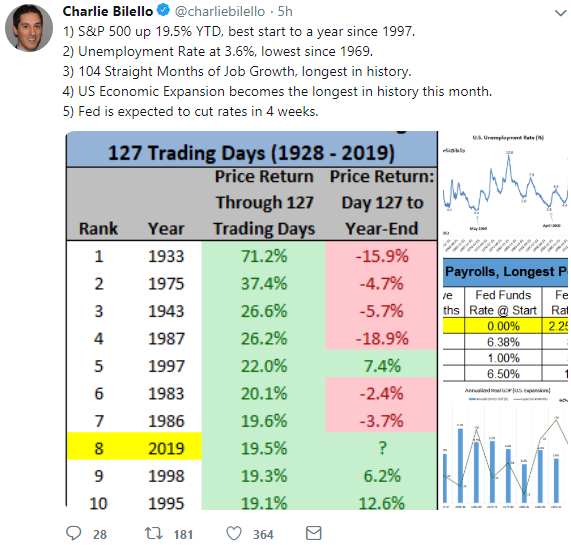
Those are some fairly compelling data points, and they come following lots of negativity and worry by many in the media. Of course for some investors, perhaps contrarians in particular, the fact that the market has done so well lately provides more nervous fuel that “we’re due” for a bit of a pullback?
A question worth asking yourself… “Is your nest egg at the mercy of the stock market? And to what extent?”
For example, if you simply own an S&P 500 index fund, you’re going to basically return whatever the stock market returns, and that means if the market takes a nosedive then so too will your portfolio also take a nosedive.
Historically, the conventional wisdom has been to diversify some of your stock market risk away by owning high quality bonds. But the problem with that strategy now is that with the 10-year treasury again recently dipping below 2% so too have the yields on investment grade corporate bonds to the extent that their returns are just not very compelling to many investors.
So what’s an investor to do if they want to earn a return without being at the mercy of a rapidly climbing stock market that makes many investors nervous? The market is up a lot this year, but you only have to look back to the fourth quarter of last year to see how the market can turn ugly quickly. And while the recover to that sell-off was fairly quick, it took considerably more time for the market to recover from a considerably larger pullback during the financial crisis, which really wasn’t that long-ago to those of us that have been participating in the markets for a while.
As one alternative solution, there are many trading strategies that offer lower correlations with the overall stock market. For example, long-short funds, market neutral strategies, and a variety of shorter-term trading strategies too. These alternative approaches can help diversify away some of that stock market risk that is keeping many investor awake at night, while still offering the potential for compelling long-term returns. We’ll discuss some specific examples of trades and trading strategies later in this report.
Model Performance
We are sharing the performance of our proprietary trading models as our readers have requested.
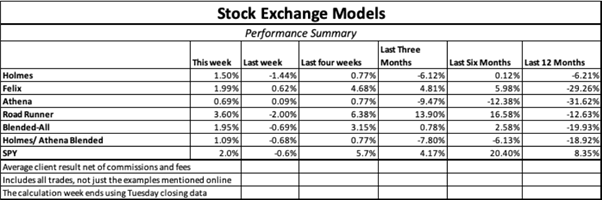
Worth noting, our models increase and decrease their cash levels based on market conditions, so the performance in the table can appear more dramatic than reality, especially when considering the strategies are often combined with some of our longer-term strategies as well. Also, we’ve been running these models for a while and backtested the data for very long time periods and thereby understand there are stronger and less strong periods. However, over the long-term we remain very confident in the trading models and continue to invest our own capital according to the models.
For more information about our models (and their specific trading processes), click through at the bottom of this post for more information (readers are additionally invited to write to main at newarc dot com for our free, brief description of how we created the Stock Exchange models).
Expert Picks From The Models
Note: This week’s Stock Exchange report is being moderated by Blue Harbinger, a source for independent investment ideas.
Holmes: I know I am a computer model and not a person, but I am going to brag this week. I bought shares of AMD (AMD) on 6/18 and sold them on 7/1 for a healthy profit.
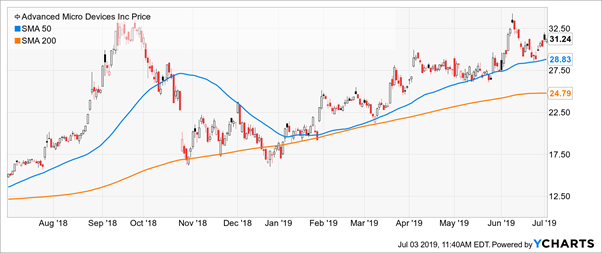
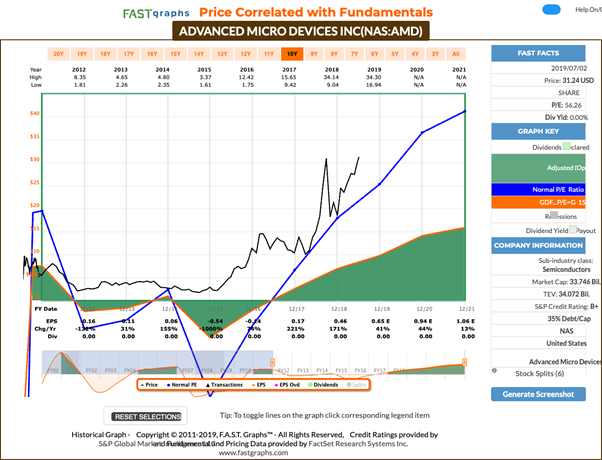
Blue Harbinger: A little anthropomorphic, are we Holmes? That is a nice trade. Those chip stocks have been a little volatile lately with all the China trade talks going on. I suppose that volatility is good for a “dip buyer” like you. I think the semiconductor industry in general will do well over the long-term considering all the smart device computing power. Here is a look at the F.A.S.T. Graph with some fundamental data, Holmes.
Holmes: There’s more to it than simply calling me a “dip buyer.” You’re on the right track, but more specifically, I use a mean-reversion approach to identify stocks that have moved “abnormally” far from their recent price history. And AMD did, and I also identified the additional conditions necessary for me to purchase.
BH: Nice trade, Holmes. And how about you Road Runner, any trades to share this week?
Road Runner: I bought Square (SQ) this week. How do you feel about that?
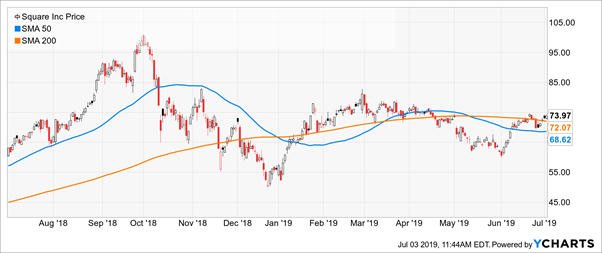
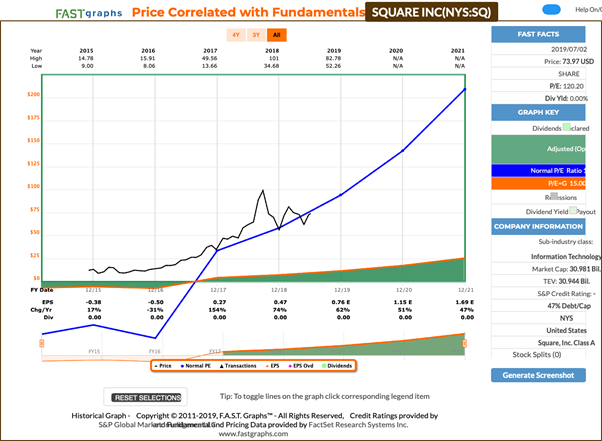
BH: Jeez, Road Runner. We were just talking earlier in this report about ways to place trades that are not highly correlated with the market? Square is a very high beta (around +2.0, depending on which time frame you look at) fintech company. If the market goes up, so does Square. And if the market goes down, so does Square. But in both cases, Square’s price moves are usually much more dramatic. It’s a fast grower, but it’s got a very high valuation and its not really profitable. Here is a look at the F.A.S.T. Graph.
RR: Really? You want to talk to me about beta? That’s a stat normally calculated over a 3-year time period. I usually only hold for about 4-weeks. So your beta and long-term fundamental data are nice, but really not all that useful to me. Generally speaking, I am a momentum trader, and I like to buy stocks in the lower end of a rising channel as you can see in the Square chart below.
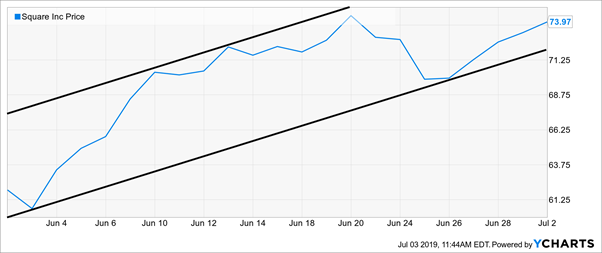
And for your information, I look for a certain type of situation (some call it a pattern, others may call it a setup, etc.) where the probability of a particular action is not a matter of chance (50/50) but has been historically noted to result in a greater tendency towards a particular outcome. “Trending in a channel” is one such situation. An equity will often “cycle” between the upper and lower bounds of that channel for substantial periods of time. My model design attempts to take advantage of this property by identifying stocks trending in an upwards channel and waiting until the stock price drifts to the lower bound, making it a candidate for purchase. These types of situations have a relatively high probability of positive outcome with a reasonable profit potential. Square can be seen to be in this type of a situation. This is a short-term trade that has traditionally shown profitability when the right conditions have been met. One way or another, I’ll be out of it shortly – usually after about 4 weeks.
BH: Alrighty then. Thank you. And how about you, Athena?
Athena: I sold my shares of Tableau Software (DATA) this week for a small loss after purchasing them in mid June. As you recall, I am a momentum trader.
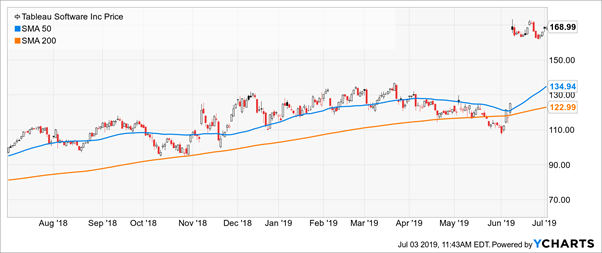
BH: Sorry that trade didn’t work out, but at least it wasn’t a disaster. I actually like that business from a long-term fundamental standpoint, maybe you should have held on to it a little longer. Here is a look at the F.A.S.T. Graph.
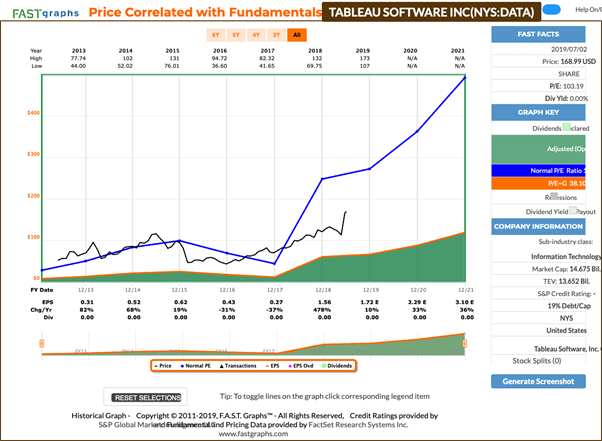
Athena: Thanks for your opinion, but I’ll stick to my strategy. I look for stocks having strong positive trends and then select only those with the very strongest trends (“king of the hill”), constantly replacing the ones with weaker trends. It should not surprise anyone that I bought Tableau. A quick look at the chart makes the strength of the trend fairly obvious. And I generally continue to hold my positions until either the strength of the trend abates or a stock with an even higher trend strength comes along. I don’t have a set “holding period” for a position. I will exit only when either a stronger stock comes along or if market conditions dictate a strong potential for loss – capital preservation remains the key driver in all situations.
Conclusion
With the market soaring this year, and reaching new all time highs this week, a lot of investors are increasingly nervous, and the media’s non-stop fear mongering doesn’t help. If you’re going to own stocks for the long-term then to a large extent you are at the mercy of whatever the stock market does. And the traditional alternative to stocks (i.e. bonds) is not all too appealing considering interest rates are so low again (the 10-year treasury fell below 2% again this week). One alternative to reducing your stock market risk, while still providing opportunity for high returns is shorter-term trading. This can involve quickly getting in and out of the market based on specific set ups and opportunities. This prevents you from being exposed to the overall stock market “beta” risks all the time, and still creates opportunities to generate attractive returns.
Getting Updates:
Readers are welcome to suggest individual stocks and/or ETFs to be added to our model lists. We keep a running list of all securities our readers recommend, and we share the results within this weekly “Stock Exchange” series when feasible. Send your ideas to “etf at newarc dot com.” Also, we will share additional information about the models, including test data, with those interested in investing. Suggestions and comments about this weekly “Stock Exchange” report are welcome. You can also access background information on the “Stock Exchange” here.
We have a new (free) service to subscribers to our Felix/Oscar update list. You can suggest three favorite stocks and sectors. We report regularly on the “favorite fifteen” in each ...
more

