
A Reality Check For The Tech Sector’s Risk Profile Amid Volatility
The Tech sector is the most profitable and fastest-growing sector in the S&P 500. Though it is considered by many investors to be of cyclical nature, and hence perceived to be a sector that one should avoid exposure to amid expectations of weakening economic conditions and rising volatility ahead. Nevertheless, the thrill of financial market data analysis lies in entering into uncharted territory, digging into numbers that others are shunning. The return of volatility in 2018 led to negative performances for various sectors, culminating into negative results for risk-adjusted performance measures, which are considered useless among research analysts. However, while individually these negative results may be meaningless, putting the negative results of various sectors together actually helps uncover insightful revelations about how the Tech sector is not as risky as perceived in comparison to other sectors, and that long-term investors should continue holding exposure to the sector even amid expectations of increased volatility.
We will compare the risk-adjusted performance of the Tech sector (during 2018) to defensive sectors, for which sector ETFs (issued by State Street Global Advisors) will be used as proxies for sector performance.
Two common measures of risk-adjusted performance are the Sharpe and Sortino ratios. While the Sharpe ratio is useful for determining how effectively the security delivers returns per unit of volatility, its biggest flaw is that because it uses the standard deviation as a measure of volatility risk, it considers upside deviation as risky as downside deviation, which is certainly not the case given that upside movements are favorable for the investor. Hence for more effective risk-adjusted analysis, we will use the Sortino ratio to determine how the ETFs performed during the volatile 2018. The Sortino ratio only considers downside deviation as volatility risk to the investors, by only taking the standard deviation of negative returns. However, let us take this a step further and modify the Sortino ratio so that it better allows us to analyze the performance of the securities amid risks of negative performance. In the traditional Sortino ratio, the standard deviation in the denominator calculates the deviation of negative returns from the mean (of negative returns), and thus reflects how much all the negative returns deviate away from the average negative return. However, it would be more worthwhile to use ‘0’ instead of the ‘mean negative return’ when determining the security’s downside deviation. Thereby, we will not calculate the standard deviation based on the deviation of data points away from the average negative return, but instead from ‘0’. This results in a better examination of the risk-adjusted performances of the securities, as it adjusts for the extent to which the security performances can deviate into negative territory, away from ‘0’.
The Sortino ratios have been calculated by taking the average monthly return for each ETF, subtracting the risk-free rate from each of those returns (to derive at excess monthly returns), and then using those excess returns to calculate the average monthly excess return. This result was then divided by our modified standard deviation of the negative monthly returns. Note that the risk-free rate used is the average 1-month Treasury yield during 2018 (to match with the monthly returns scale). The annualized results can be found in the table below.
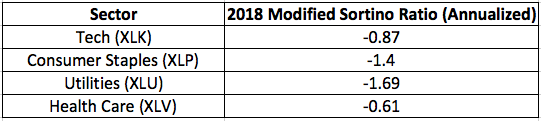
Data Source: Sortino ratios have been calculated using price data from Yahoo Finance
At first glance, the negative results may encourage analysts to neglect these numbers, dismissing them as meaningless. However, interpreting these numbers can actually extract some insightful facts. Traditionally, positive Sortino ratios are interpreted as ‘the higher the better’, as this would imply higher risk-adjusted returns. Therefore, for negative Sortino ratios, the closer they are to ‘0’ the better, as this would imply minimal loss after having adjusted for downside risk. The Tech sector ETF (XLK) actually delivered a lower risk-adjusted loss (-0.87) than the defensive Consumer Staples (XLP) and Utilities (XLU) sector ETFs and was not considerably worse compared to the Health Care ETF’s (XLV’s) ‘-0.61’ result. Hence, the Tech sector actually offered attractive risk-adjusted returns in comparison to the defensive sectors.
Although keep in mind that interpreting negative Sortino ratios becomes tricky due to the possibility that a lower risk-adjusted loss could have been obtained due to a higher downside standard deviation (downside volatility) in the denominator, which would be undesirable. Thus it is essential to determine whether the smaller negative Sortino ratio was in fact due to a lower actual loss, or a higher downside standard deviation in comparison to the defensive sectors. The table below exhibits the average monthly excess returns and downside standard deviations for each ETF being assessed.
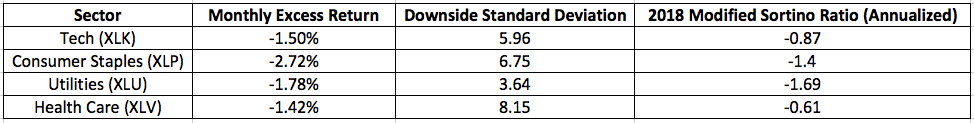
Note that the Sortino ratios have been annualized, which means the results of dividing the average monthly excess returns by their downside standard deviations have each been multiplied by √12.
While the modified downside standard deviations are quite high for each security, the Tech sector ETF (XLK) actually has a lower downside standard deviation than the defensive sector ETFs, except for the Utilities sector ETF (XLU). Furthermore, even though the Health Care ETF (XLV) offered a better Sortino ratio, the table above reveals that the lower risk-adjusted loss (compared to XLK) was actually in large part due to a much higher downside standard deviation in the denominator (of 8.15). Therefore, having taken the downside standard deviations for each ETF into consideration, the Tech sector ETF (XLK) offered a more limited risk-adjusted loss compared to the defensive sector ETFs. As a result, this contradicts the notion that the Tech sector is more risky and volatile in nature compared to the defensive sectors, as it offered a comparatively better Sortino ratio. Nevertheless, past performance is not always a reliable indicator for future performance, and thus we need to understand what underlying factors have resulted in this better risk-adjusted performance, to determine whether it is sustainable going forward.
What's behind the Tech sector's favorable Sortino ratio?
The reason behind the better risk-adjusted performance lies in the largest industry of the Tech sector, the software industry. With regards to the XLK ETF, the Software & IT services industry makes up 52.45% of the fund’s holdings (at time of writing). This is an industry in which corporations are increasingly adopting a recurring revenue business model, which incurs a stable and mostly predictable stream of top line sales revenue over the long-term.
Software services, namely business-to-business software services, have become an essential business expenditure, as these types of services aid companies in constantly enhancing efficiency and productivity to stay competitive and support top-line growth. Moreover, software updates also tend to offer more opportunities for cost-savings, which encourages corporate consumers to continue upgrading to persistently improve their bottom-line earnings as well. As a result, companies are enticed to continue spending on software services even during times of weakening economic conditions. In fact, these periods are often when pressures on cost-efficiency are highest, and companies constantly feel the need to stay competitive to avoid losing customers/market share to more technology-advanced and efficient competitors. Within the software industry, the cloud market is witnessing booming revenue growth and a secular growth trend, as companies increasingly adopt cloud technology into their businesses to stay competitive. Hence the strength in demand for the software industry’s services and their ‘recurring revenue’ nature is a factor that offers resilience even during times of economic weakness. What are the numbers saying? Let us assess some statistics that reflect the strength of the software industry. In the table below, the growth rates for worldwide corporate spending on various tech segments have been collated using reports from Gartner, and a 5-year average growth rate for each segment has been calculated using this collected data.
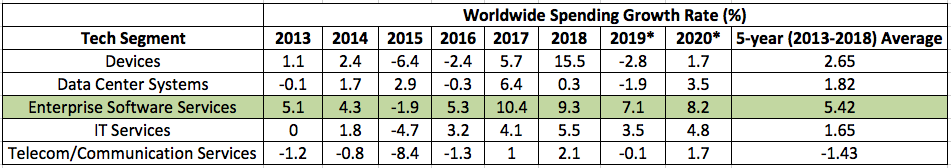
Data Source: Gartner
The global economy faced a GDP growth slowdown in 2015/2016, during which all tech segments witnessed a slowdown in corporate spending growth. Nevertheless, overall the software industry remained one of the best performing segments, and over the 5-year period from 2013 to 2018, it delivered the highest average growth rate of 5.42%. In fact, amid expectations of an economic slowdown in 2019/2020, corporate spending growth on tech is expected to decline again. However, the data shows how the software industry is still anticipated to witness the highest corporate spending growth even amid a slowing economy, with 7.1% growth expected in 2019 and 8.2% growth expected in 2020, while spending growth rates for some other segments are expected to fall into negative territory. Hence this resilience of corporate spending on software services gives the industry defensive characteristics, which should allow the Tech sector ETF (XLK) to maintain appealing risk-adjusted performances/ Sortino ratios, in comparison to the defensive sectors, going forward.
Therefore, investors that are positioning themselves for slowing economic growth and potentially higher volatility ahead should not avoid exposure to the Tech sector as a whole, given the secular growth trends and recurring revenue models enjoyed by the high-growth software industry within the sector. In fact, with regards to the XLK ETF, 6 out of the top 10 holdings of the fund are companies that are engaged in offering software/cloud services, which collectively make up 35.31% of the fund’s holdings. Hence, this is an attractive ETF to hold exposure to even amid slowing economic conditions, as it provides exposure to the strong secular growth trends witnessed in the software/cloud industry and the resiliency of recurring revenue models during economic slowdowns.
Bottom Line
Many investors misconceive the Tech sector as holding highly-cyclical/ economically-sensitive characteristics, which misleadingly encourages them to cut exposure to the Tech sector when an economic slowdown/ increased financial market volatility is expected, and instead increase exposure to defensive sectors. However, research finds that during the volatile 2018, the Tech sector ETF (XLK) delivered better risk-adjusted performance, with a Sortino ratio of -0.87, than the defensive sector ETFs (XLP, XLU, and XLV). While negative results for Sortino ratios are usually neglected by analysts, putting them together for comparative analysis actually helped uncover the more attractive risk-reward attribute of the Tech sector in comparison to the defensive sectors.
Furthermore, it is the secular growth trends and recurring revenue models within the largest industry of the Tech sector, the software industry, that are allowing for better risk-adjusted performance for the Tech sector in comparison to defensive sectors during periods of economic concerns/higher volatility, as witnessed during 2018. Even as economic conditions are expected to slow during 2019 and 2020, the software industry is expected to witness the highest corporate spending growth rates, 7.1%, and 8.2%, respectively.
Therefore, investors should certainly not avoid exposure to the Tech sector amid expectations of weakening economic conditions/higher equity market volatility, because over the long-term, it is these secular growth trends and recurring revenue models within the software industry that will deliver superior returns throughout fluctuating economic/ market conditions.


