
Support & Resistance: Technical Analysis 101
Is there a more central concept in technical analysis than support and resistance? Of any other principle, this is extremely central to all traders and is based on the concept of price agreement. Sure, there are the typical descriptions using the imagery of a floor or a ceiling, but what’s really behind it? In this introduction to technical analysis, we’ll explore the basics of price movement and the establishment of support and resistance levels.
Price Action Basics
When the price of any security finds support or resistance, the supply and demand are balanced momentarily before seeing the price change directions. The price movement between these inflection points represents an imbalance in the supply provided, or the quantity demanded. That’s great to know, but how is this playing out?
Every traded security, whether stock, option, futures, crypto or currency pair has a bid and an ask price. The bid and ask represents the best available bid and offer. If a trader were to use a market order to buy a stock, they would end up taking the ask price, and vice versa for sellers. If there are more traders willing to sell at the bid than buy at the ask, this causes the price to fall. This means that sellers on in control. This happens momentarily throughout the course of the day but doesn’t always create a reversal in the price trend.
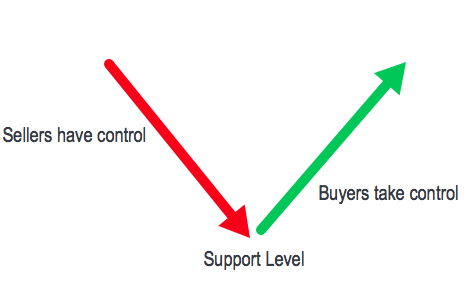
Support
The image below reflects a selling imbalance where the price is falling with sellers in control. Buyers then take control of the price trend when the supply of sellers is exhausted. The support is the low of the pullback before the price begins to rise.
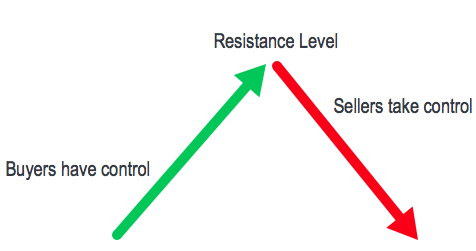
Resistance
The next image reflects a buying imbalance where the price is rising with buyers in control. A resistance level forms as buyers and sellers become balanced. The exhaustion of buyers gives control of the price to the sellers. A resistance level is the high price achieved before the price begins falling.
Application of Support and Resistance
The establishment of support and resistance levels not only contribute to entry and exit points but also project future areas of support and resistance. These price levels where there is agreement are significant in the future and the more that the level is used, the more significant it becomes. Many technicians will draw trendlines across highs and lows that are established. The image below shows a bullish trendline. The line is drawn across a series of higher lows that are moving in a linear fashion.

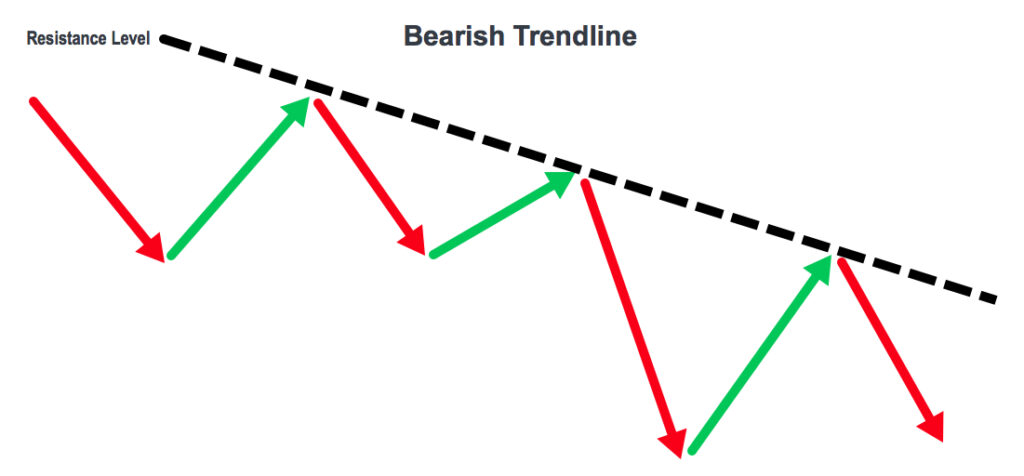
The next example is a bearish trendline. A line can be drawn across a series of lower highs that are moving linearly.

A price channel is another pattern that forms. A channel forms when two parallel lines can be drawn across the highs and lows. Channels can form in either an uptrend, downtrend or neutral trend.
In the previous examples, the drawn trendlines were across highs or lows, but not both. However, sometimes the levels will align so that highs and lows will match up. This establishes an important principle of support and resistance. The principle is that old resistance that is broken will become new support and old support that is broken will become new resistance. That means that trendlines can be drawn across highs and lows together. In the image below, a trendline is extended from previous highs (resistance) and would create a current projected area support. That support may be used as an entry opportunity to go long.

This next example has a trendline drawn across the old support that is projecting an area of resistance for the price since it has fallen below it. As the price approaches the trendline, a trader may be looking for an opportunity to go short.

Conclusion
Being able to identify support and resistance is central to technical analysis. This is because the intent of the technical analysis is to enter at the beginning of the trend and end near the end. Being able to identify these levels is helpful for establishing the price trend and are central to triggering entry and exit opportunities for swing and trend trades.
Disclaimer: Neither TheoTrade or any of its officers, directors, employees, other personnel, representatives, agents or independent contractors is, in such capacities, a licensed financial adviser, ...
more

