Yet Another Ridiculous Stock Market Bubble, In Three Charts
The Fiat Currency Age is nothing if not repetitious.
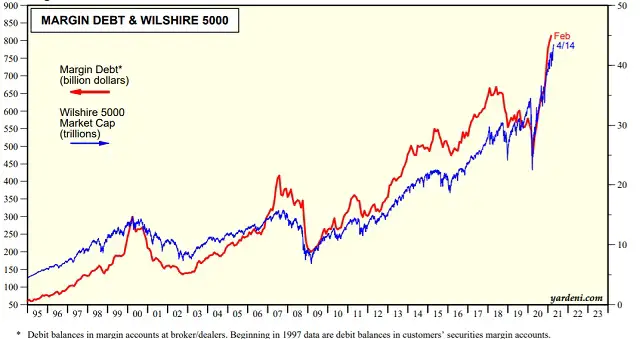
There are dozens of charts that illustrate how closely today’s financial bubble resembles its predecessors. But simple is better when expressing a hard truth, so let’s go with that old standby, margin debt. This is debt created when over-stimulated investors borrow against their stocks to buy more stocks. At its high extremes, the result is always the same: A price decline that forces overleveraged investors to liquidate at any price, turning correction into a bloodbath. Note that the steeper the rise in margin debt, the more severe the resulting plunge in share prices.

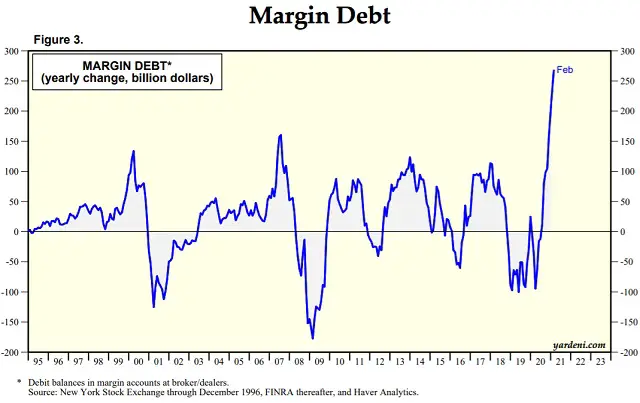
The next chart illustrates more clearly the “steep” thing. The current spike is one for the record books.

Now, during past spikes in margin debt the “investors” who were swept up in the euphoria of easy money frequently responded to criticism with a variation on “corporate earnings are about to soar, which will make everything okay. Plus we know you’re only complaining because you missed the gravy train and you’re jealous.”
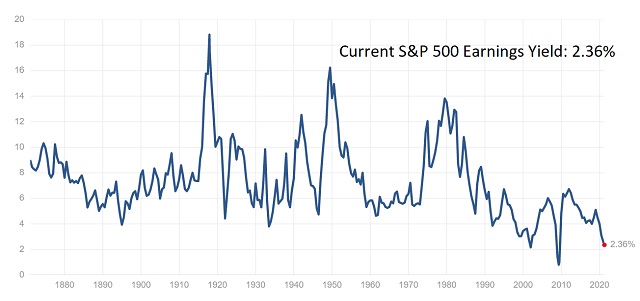
But corporate earnings almost never completely offset extreme valuations and soaring margin debt. A useful measure for visualizing this fact is “earnings yield,” which is the S&P 500 index’s aggregate earnings expressed as a percentage of its aggregate market cap. This is how much a buyer of the average stock receives in earnings per dollar invested. Common sense says the more the buyer receives the better the deal. And history says the less the buyer receives the higher the likelihood of stock prices falling in the ensuing few years. Today’s yield of 2.36% is the second-lowest ever. That’s really bad.

So here we are again. Stocks are soaring because corporate earnings are going to rise even faster. Yet – this being the peak of a long cycle – interest rates are also up, inflation is stirring, government deficits are otherworldly, and geopolitics are unsettled. It’s a virtual lock that corporate earnings will not save anyone this time around.
As in the 1970s, 1980s, 1990s, and 2000s, we’ve reached the point where share prices have to restore balance by falling to where it makes logical (as opposed to emotional) sense to own equities. And given the parabolic rise in margin debt, the process won’t be pretty.
As hedge fund manager David Einhorn recently lamented, “From a traditional perspective, the market is fractured and possibly in the process of breaking completely.”


Why does it matter, you can make money as it goes up then you can make money as it goes down, follow the charts not the politics.