
Xencor - Chart Of The Day
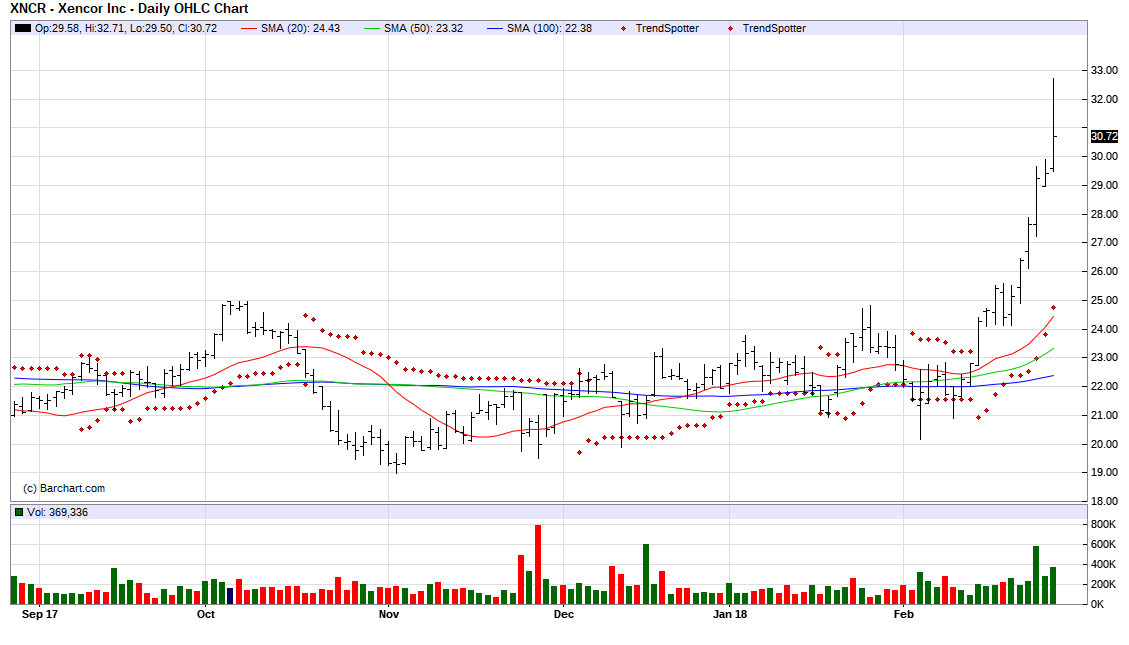
Something is going on with Xencor (XNCR)? The chart of the day belongs to Xencor (XNCR). I found the biopharmaceutical stock by using Barchart to sort today's New 52 Week High list first for the highest technical buy signals, then I used the Flipchart feature to review the charts for consistent price appreciation.Since the Trend Spotter signaled a buy on 2/14 the stock gained 28.80%.
Xencor Inc. is a clinical-stage biopharmaceutical company. It develops antibodies for the treatment of autoimmune diseases, asthma and allergic diseases, and cancer. Xencor Inc. is based in Monrovia, California.
(Click on image to enlarge)
Barchart technical indicators:
- 100% technical buy signals
- Trend Spotter buy signal
- Above its 20, 50 and 100 day moving averages
- 11 new highs and up 32.51% in the last month
- Relative Strength Index 81.33%
- Technical support level at 28.94
- Recently traded at 30.68 with a 50 day moving average of 23.33
Fundamental factors:
- Market Cap $1.39 billion
- Revenue and Earnings all over the map
- In spite of this the price is moving up???
- Wall Street analysts issued 4 strong buy recommendations on the stock
- The individual investors following the stock on Motley Fool voted 39 to 1 that the stock will beat the market
Disclosure: None.
How did you like this article? Let us know so we can better customize your reading experience.

Comments
Leave a comment to automatically be entered into
our contest to win a free Echo Show.

