
Wrangle The Ranges
Last week was interesting, because for the first time in over a decade, the market actually responded logically to economic data. In other words, bad economic news hit on Tuesday morning, and blammo, the market fell hard.
The good sense didn’t last, of course, and from Thursday morning until Friday’s close, the market roared almost 1,000 points higher on the Dow, and about 100 points higher on the ES, based on……….nothing:
Well, I say “nothing”, but there is a “something”, which is the $185 billion the Fed has thrown at the market to prop it up. After all, since the market fell a tiny bit, the government knows its frail, whimpering, snowflake citizens can’t tolerate it, so they cranked up the electronic printing presses and buried the market in hundreds of billions of dollars of fresh “cash” through their REPO operations. It’s all a gargantuan farce.
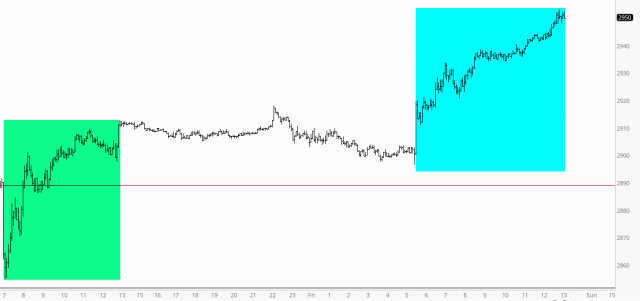
What’s fascinating to me, though, is the squeaky-clean horizontal lines in action. And I didn’t draw these lines after the fact. These are old, crusty lines. And yet they still seem to matter. Take a look:
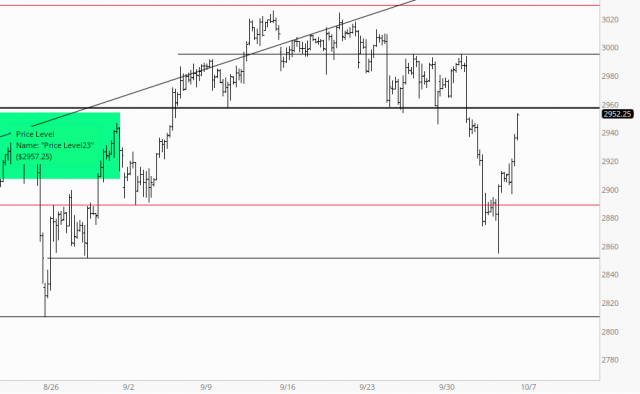
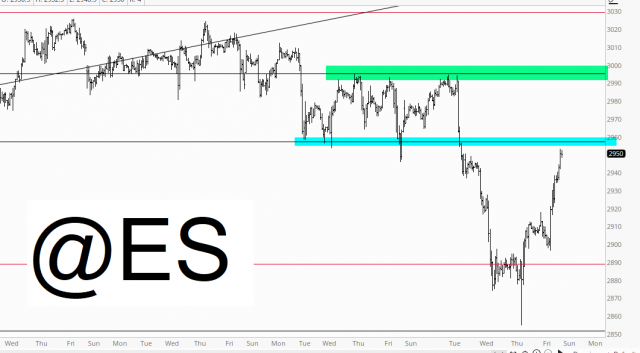
Thus, the ES slipped through multiple support levels, found support on Thursday morning (after the second bad ISM print) and then exploded up to the line I’ve highlighted at 2957.25. Looking at it somewhat closer, you can see how the green tint represents the former resistance while the cyan tint represents what had been the new support, but now has a role as resistance. We just about kissed it perfectly during the buying mayhem on Friday.
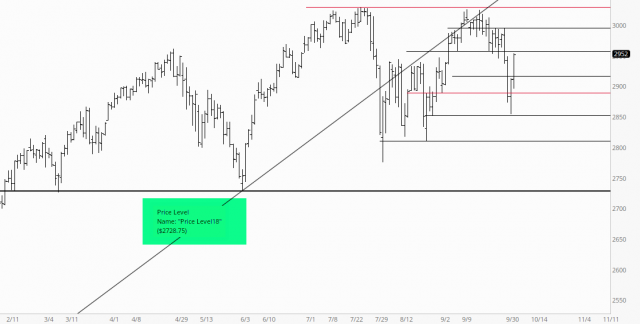
You can see these same lines from an even longer-term perspective. The low point for the year 2019 is light years away right now (the thick black horizontal), but in the meantime, we’re banging between these other horizontals with shocking reliability.
Disclosure: None.


