
With Stocks Amidst New Round Of Selling Pressure, FOMC Meeting Next Week Could Decide If This Stops
With Stocks Amidst New Round Of Selling Pressure, FOMC Meeting Next Week Could Decide If This Stops, Pauses Or Continues
Bears are making a killing. Stocks have come under renewed selling pressure. The S&P 500 is very close to losing 20 percent on a closing basis. Amidst this, fresh from a 50-basis-point emergency cut of last week, the FOMC meets next week. A lot is riding on what comes out of that meeting.
Bears’ conviction is paying off.
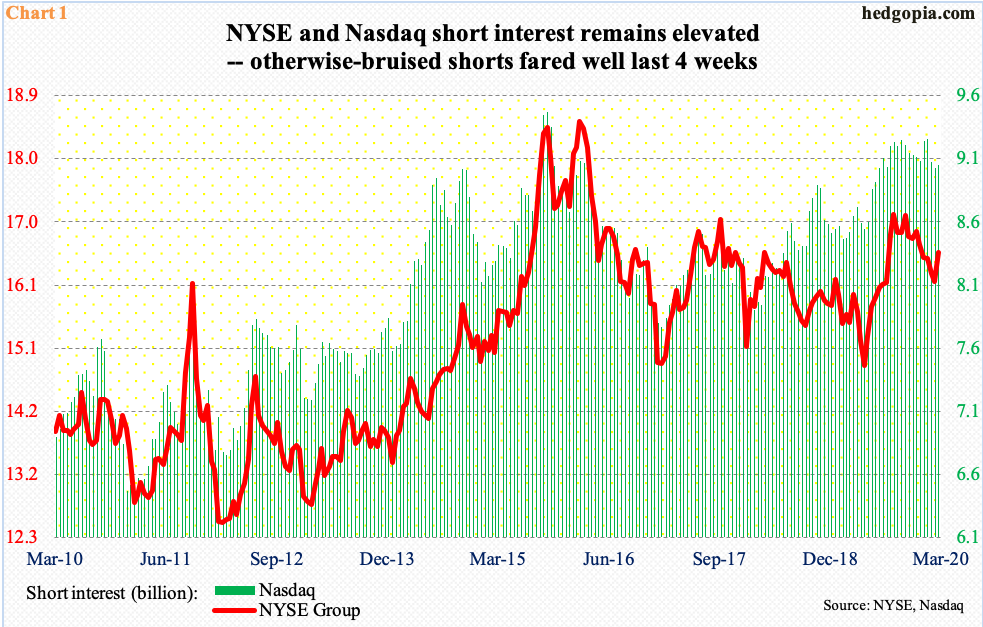
At the end of February, both NYSE and Nasdaq short interest rose period-over-period – up 2.7 percent and 0.3 percent respectively, to 16.6 billion and 9.1 billion shares. This preceded short-covering that lasted several periods – NYSE in particular (Chart 1).
Most recently, NYSE short interest peaked at 17.1 billion at the end of last August. This was the highest since March 2016. Similarly, the mid-January total of 9.3 billion on the Nasdaq was the highest since October 2015. Before mid-February, shorts were hurting massively as major US equity indices relentlessly pushed higher. The prevailing carnage in stocks has tilted the balance shorts’ way.
If there is any consolation for longs in all this, it is this. Because short interest remains elevated, as shorts cover and lock in profit, this should help form a bottom – eventually.
Thus far, sellers continue to dominate action.
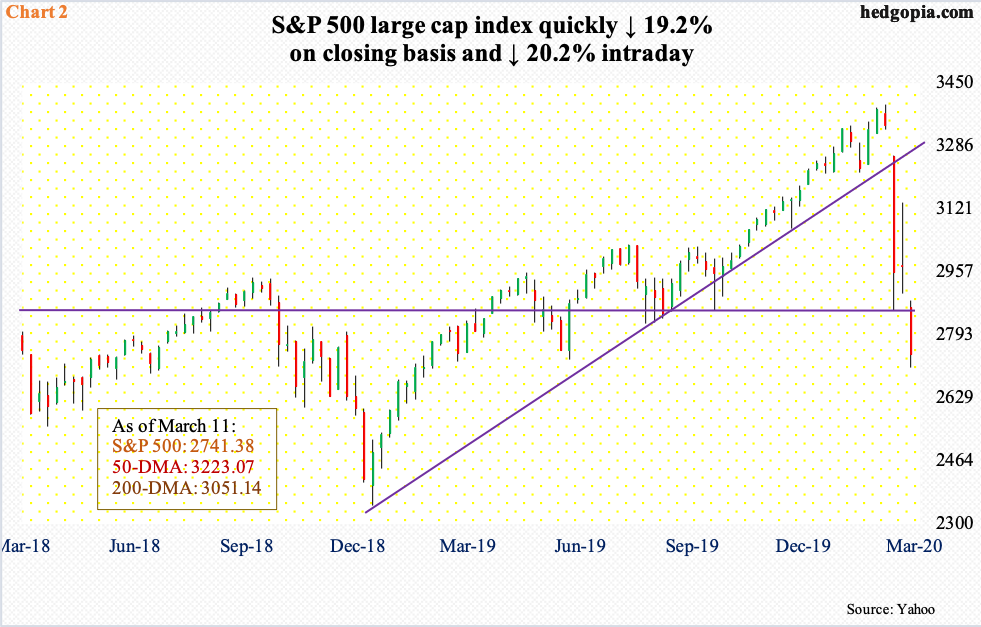
On a closing basis, the S&P 500 large-cap index (2741.38) collapsed 19.2 percent in less than a month. Intraday Wednesday, it was down 20.2 percent. Overnight futures are down big – in excess of four percent. Markets are not satisfied with what President Trump offered Wednesday evening. If the selling pressure continues as the cash opens and closes later today, the index will have dropped north of 20 percent.
Conventionally, a drop of 20 percent is viewed as the beginning of a bear market. As the bear headline hits, it is possible it acts as a self-fulfilling prophecy. In fact, this could very well be taking place in the overnight action.
At the same time, it is also a time to be on the lookout for a trading opportunity. There was one at the end of last month when the index surged 9.8 percent intraday in three sessions. The February 28th low of 2855.84 has now been undercut (Chart 2). This level – or just north of 2800 – should now act as resistance when stocks reverse higher.
Several indicators are rapidly approaching oversold – even washout – territory.
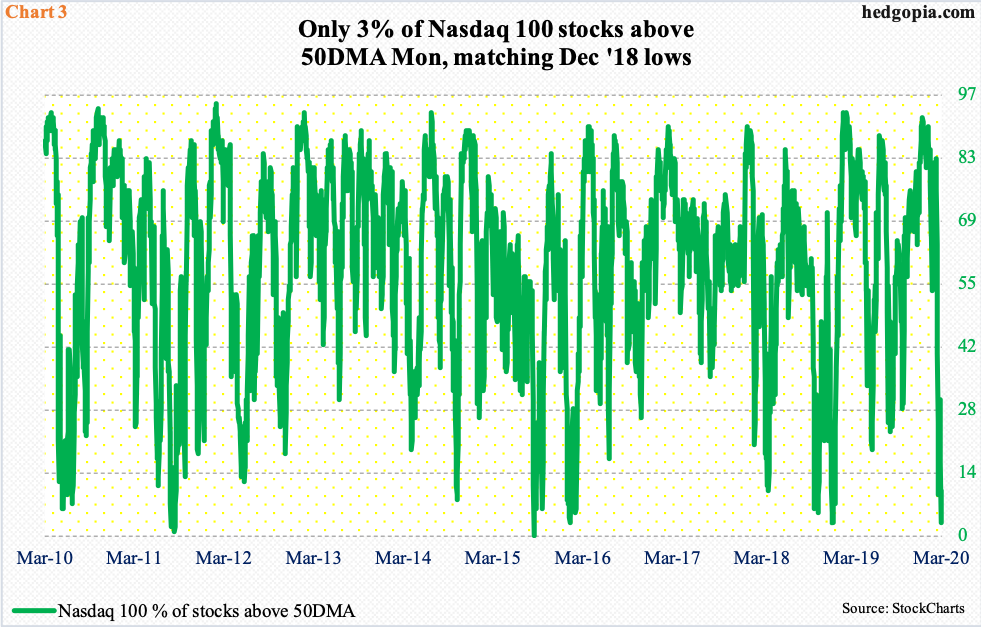
Wednesday, merely five percent of Nasdaq 100 stocks were above their 50-day moving average. On Monday, this was down to three percent, matching the low of Christmas Eve of 2018 (Chart 3). The Nasdaq 100, along with other equity indices, formed a major bottom in December that year (Chart 2).
Mid-January, this metric hit 90 – well into the extended territory. Now, the pendulum has swung the other way.
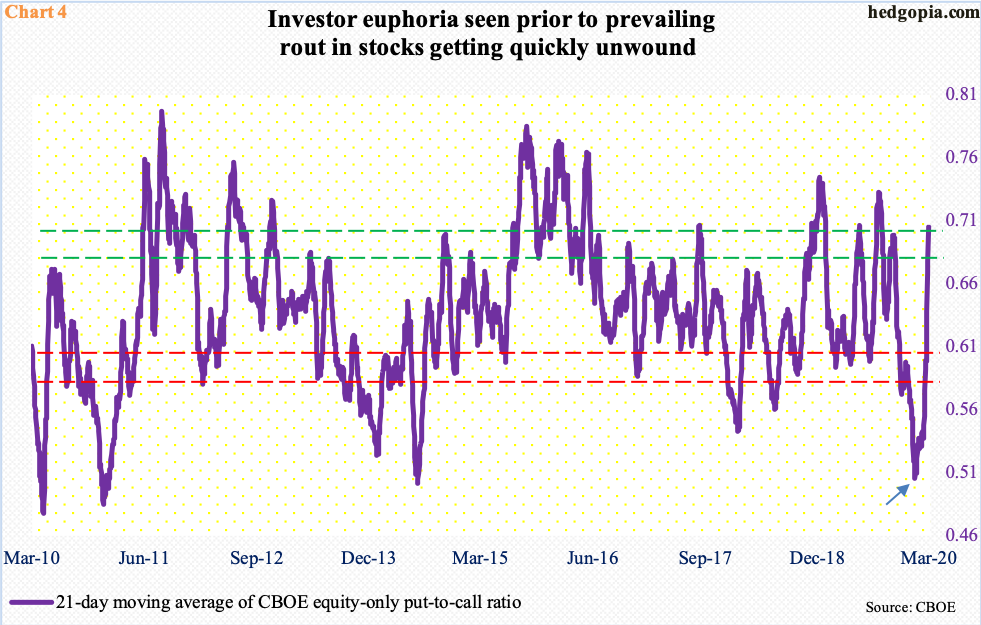
Also mid-January, the 21-day moving average of the CBOE equity-only put-to-call ratio dropped to 0.506 (arrow in Chart 4), which was the lowest since July 2014. Investor optimism was euphoric. The prevailing bloodbath in equities has unwound pretty much all of it.
Twice this week, the daily ratio exceeded one – 1.12 on Monday and 1.02 on Wednesday. The last one-plus reading occurred in December 2018. As a result, the 21-day average ended Wednesday at 0.704. This can continue to push higher – as has been the case in the past – but this is also a level where it can begin to reverse.
Similar dynamics are in play elsewhere.
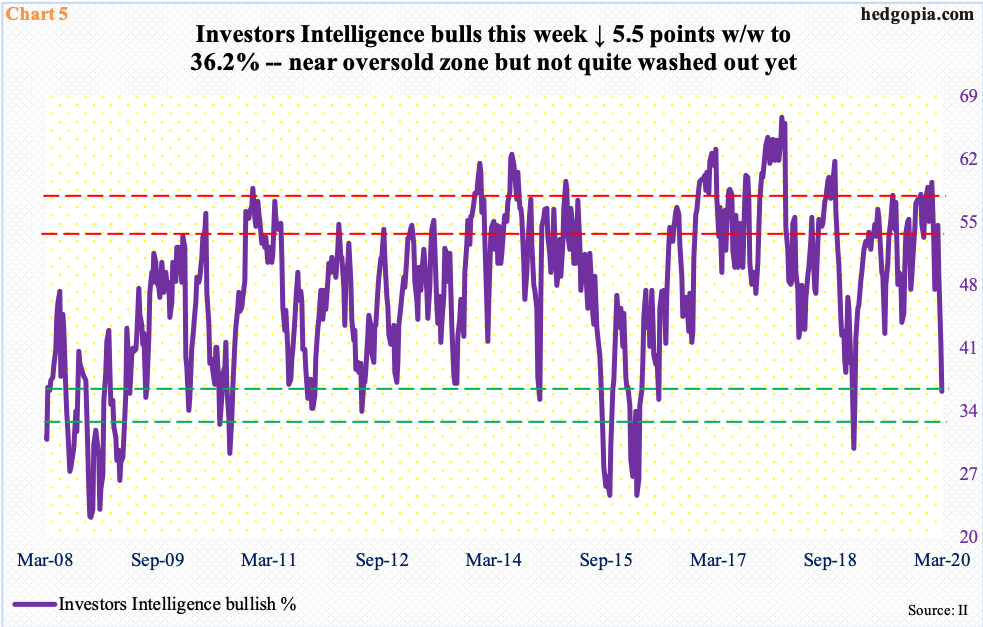
Investors Intelligence bulls dropped 5.5 percentage points this week to 36.2 percent (Chart 5). Seven weeks ago – in the week to January 21 – their count was 59.4 percent!
This week’s reading is the lowest since January last year. Back then, in the first week that month, bulls were only 29.9 percent, before trending higher. Bears were 34.6 percent back then. This time around, bears were still sitting at a comfortable 22.9 percent this week. There is lots of room for bearish sentiment to increase, even as bulls can still drop a tad.
Near-term, a sharp reflex rally in these indices is possible any time – if nothing else just to unwind oversold conditions. Medium- to long-term, the speed at which the selling has taken place deserves attention. There has been a lot of technical damage. Resistance is galore. Repair work needs time.
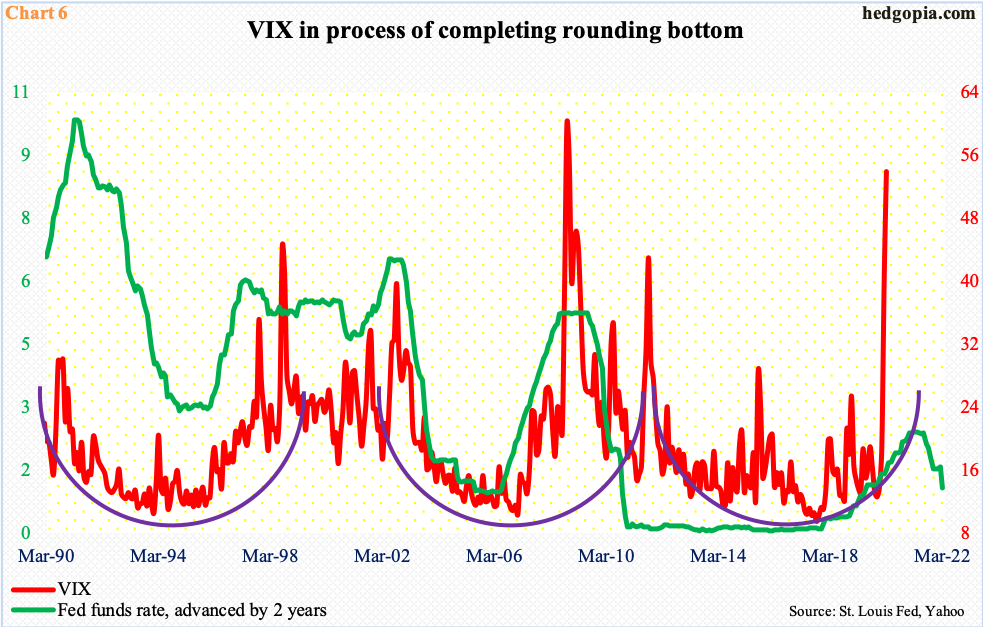
From this perspective, Chart 6 presents an interesting angle into all this.
Since its creation in 1990, VIX has carved out three multi-year saucer bottoms. The first two have been completed. The third in all probability is in the process of doing so.
Historically, the fed funds rate tends to lead volatility. In the chart, the benchmark rate is advanced by two years. The last hike took place in December 2018, to a range of 225 to 250 basis points. Since then, it has been cut by 125 basis points – 75 basis points last year in three 25-basis-point increments and an emergency 50-basis-point cut last week. The FOMC is scheduled to meet next week. Markets expect at least a 75-basis-point cut in that meeting.
After this, rates will be pretty much zero-bound, opening the door for unconventional tools such as purchase of Treasury and mortgage-backed securities, and possibly corporate bonds, and who knows even stocks. In this scenario, it is possible stocks try to stabilize before next week’s two-day meeting, which begins Tuesday. Even if things evolve this way, markets could very well interpret Fed action as inadequate – the same way President Trump’s speech yesterday was viewed. If it is viewed favorably, then the aforementioned resistance on the S&P 500 comes into focus (Chart 2).


