
Winnebago Is Top Upgrade This Week
Life On The Road, The American Dream
For today's edition of our upgrade list, we used our website's advanced screening functions to search for UPGRADES to BUY or STRONG BUY with complete forecast and valuation data. They are presented by one-month forecast return. Winnebago (WGO) is our top-rated upgrade this week.
|
Ticker |
Company Name |
Market Price |
Valuation |
Last 12-M Return |
1-M Forecast Return |
1-Yr Forecast Return |
P/E Ratio |
Sector Name |
|
WGO |
WINNEBAGO |
28.62 |
-22.24% |
39.95% |
1.15% |
13.86% |
16.87 |
Construction |
|
FITB |
FIFTH THIRD BK |
21.21 |
-0.22% |
16.03% |
0.87% |
10.38% |
11.59 |
Finance |
|
WWW |
WOLVERINE WORLD |
20.97 |
-11.96% |
15.41% |
0.77% |
9.19% |
15.42 |
Consumer Discretionary |
|
VMW |
VMWARE INC-A |
72.91 |
-18.16% |
31.56% |
0.71% |
8.45% |
23.83 |
Computer and Technology |
|
MNK |
MALLINCKRODT PL |
62.1 |
-27.40% |
2.68% |
0.68% |
8.11% |
7.48 |
Medical |
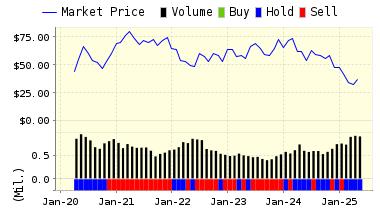
Below is today's data on Winnebago (WGO):
Winnebago Industries, Inc. is a leading U.S. manufacturer of motor homes, self-contained recreation vehicles used primarily in leisure travel and outdoor recreation activities. Motor home sales by the Company represented more than 87 percent of its revenues in each of the past five fiscal years. The Company's motor homes are sold through dealer organizations primarily under the Winnebago, Itasca, Vectra, Rialta and Luxor brand names.
VALUENGINE RECOMMENDATION: ValuEngine updated its recommendation from BUY to STRONG BUY for WINNEBAGO on 2016-10-21. Based on the information we have gathered and our resulting research, we feel that WINNEBAGO has the probability to OUTPERFORM average market performance for the next year. The company exhibits ATTRACTIVE Momentum and Sharpe Ratio.
|
ValuEngine Forecast |
||
|
Target |
Expected |
|
|---|---|---|
|
1-Month |
28.95 | 1.15% |
|
3-Month |
28.94 | 1.11% |
|
6-Month |
28.70 | 0.27% |
|
1-Year |
32.59 | 13.86% |
|
2-Year |
23.59 | -17.56% |
|
3-Year |
19.09 | -33.29% |
|
Valuation & Rankings |
|||
|
Valuation |
22.24% undervalued |
Valuation Rank |
|
|
1-M Forecast Return |
1.15% |
1-M Forecast Return Rank |
|
|
12-M Return |
39.95% |
Momentum Rank |
|
|
Sharpe Ratio |
0.69 |
Sharpe Ratio Rank |
|
|
5-Y Avg Annual Return |
24.51% |
5-Y Avg Annual Rtn Rank |
|
|
Volatility |
35.68% |
Volatility Rank |
|
|
Expected EPS Growth |
42.39% |
EPS Growth Rank |
|
|
Market Cap (billions) |
0.77 |
Size Rank |
|
|
Trailing P/E Ratio |
16.87 |
Trailing P/E Rank |
|
|
Forward P/E Ratio |
11.85 |
Forward P/E Ratio Rank |
|
|
PEG Ratio |
0.40 |
PEG Ratio Rank |
|
|
Price/Sales |
0.79 |
Price/Sales Rank |
|
|
Market/Book |
2.88 |
Market/Book Rank |
|
|
Beta |
2.08 |
Beta Rank |
|
|
Alpha |
-0.05 |
Alpha Rank |
|
Disclaimer: ValuEngine.com is an independent research ...
more

