
Why Shares Of Ford And General Motors Look To Be Charging Up For A Drive Higher
Ford Motor Co F and General Motors Company GM have developed inside bar patterns on the daily chart. An inside bar pattern indicates a period of consolidation and is usually followed by a continuation move in the direction of the current trend.
An inside bar pattern has more validity on larger time frames (four-hour chart or larger). The pattern has a minimum of two candlesticks and consists of a mother bar (the first candlestick in the pattern) followed by one or more subsequent candles. The subsequent candle(s) must be completely inside the range of the mother bar and each is called an "inside bar."
A double, or triple inside bar can be more powerful than a single inside bar. After the break of an inside bar pattern, traders want to watch for high volume for confirmation the pattern was recognized.
- Bullish traders will want to search for inside bar patterns on stocks that are in an uptrend. Some traders may take a position during the inside bar prior to the break while other aggressive traders will take a position after the break of the pattern.
- For bearish traders, finding an inside bar pattern on a stock that's in a downtrend will be key. Like bullish traders, bears have two options of where to take a position to play the break of the pattern. For bearish traders, the pattern is invalidated if the stock rises above the highest range of the mother candle.
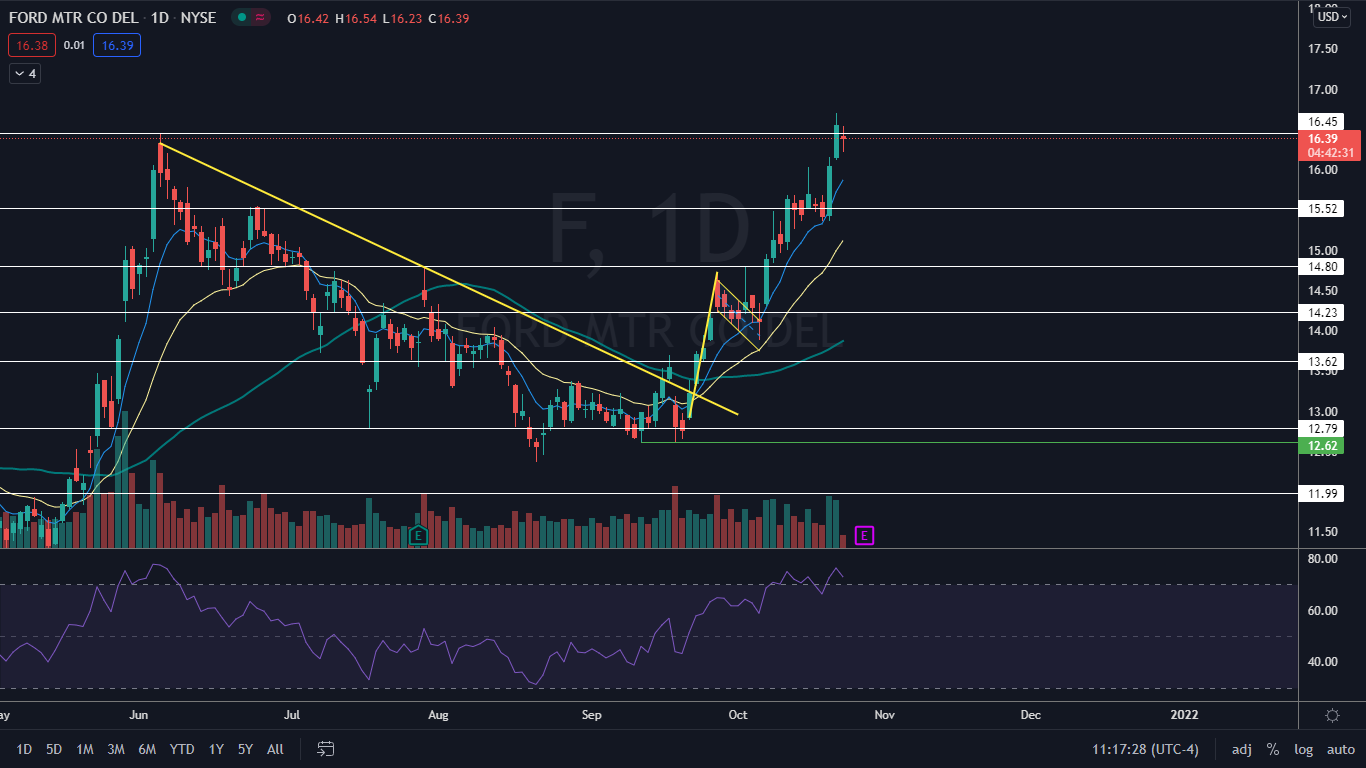
The Ford Chart: Ford reversed course after printing a bullish double bottom pattern at the $12.62 level on Sept. 20 and Sept. 21. The stock then soared 32% higher between the dates and Thursday when it hit a 52-week high of $16.70. The massive run caused Ford’s relative strength index (RSI) to become extended at 76%, which indicated the stock was in need of consolidation.
On Friday Ford was working on lowering the RSI by trading in a bullish inside bar pattern.
(Click on image to enlarge)
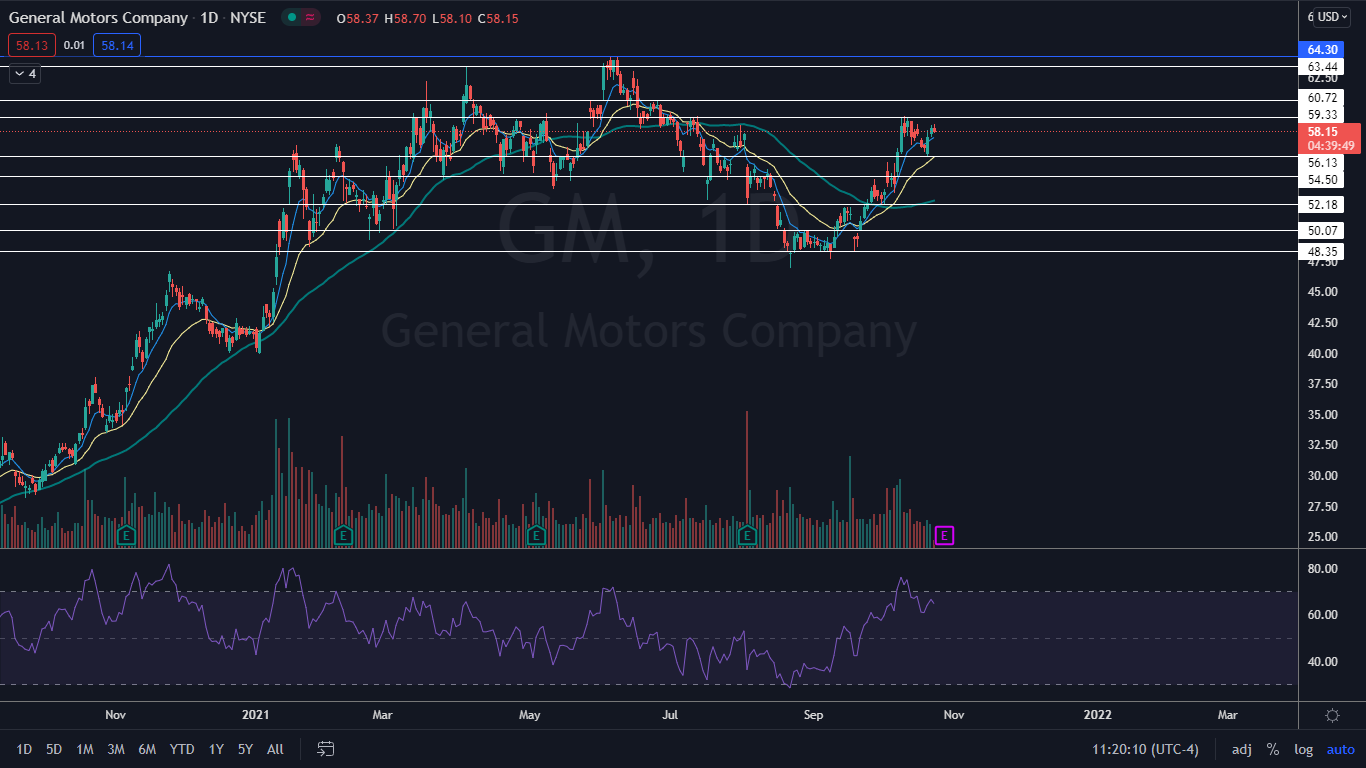
The General Motors Chart: General Motors hit a bottom at $47.07 on Aug. 23 and printed a bullish hammer candlestick, which indicated a trend change may be in the cards. The stock then soared up about 26% higher before hitting a high of around $59.33 on Oct. 11 and 12 and entering into a multi-day consolidation period.
On Wednesday and Thursday General Motors attempted to make a run for the $59 level but, like Ford’s stock, became extended. GM's inside bar pattern that is developing on Friday will help to cool the RSI.
(Click on image to enlarge)
Disclosure: © 2021 Benzinga.com. Benzinga does not provide investment advice. All rights reserved.


