
Why Roblox Stock Could Provide Solid Entry For A Long Position In 2022

Roblox Corporation RBLX was sliding over 6% lower on Tuesday, in a possible overreaction to the SPDR S&P 500 SPY, which printed a new all-time high of $479.98 before falling slightly lower.
The online gaming platform flashed signs it was headed lower over the last few weeks because the stock printed a weekly bear flag just above a lower gap. There are also signs on Roblox chart for a possible reversal, however, for traders who have patience.
Investors with different timeframes in mind for trades will often look at different charts or a combination of charts, with short-term traders watching lower timeframes such as the hourly chart or even the 15-minute timeframe. Longer-term investors, however, are more likely to focus their attention on larger timeframes such as the daily and weekly charts.
Roblox, which is one of the first platforms structured as a metaverse, has attracted celebrities and children alike, with reality TV star turned entrepreneur Paris Hilton recently creating Paris World within the virtual landscape — an island within the game where visitors can tour replicas of her Beverly Hills estate and purchase virtual clothing and rides on virtual jet-skis.
U.S. House Speaker Nancy Pelosi, who has come under fire recently for her active trading while privy to regulatory information unknown to the general public, also likes Roblox. On Dec. 20, the Democratic majority leader purchased $250,001-$500,000 worth of Roblox call contracts. She chose a strike price of $100 and a Jan. 20, 2023 expiry.
Although Roblox is currently in a bearish downtrend on both the daily and weekly charts, it will eventually develop reversal signals, which could provide a solid entry for bullish traders and investors.
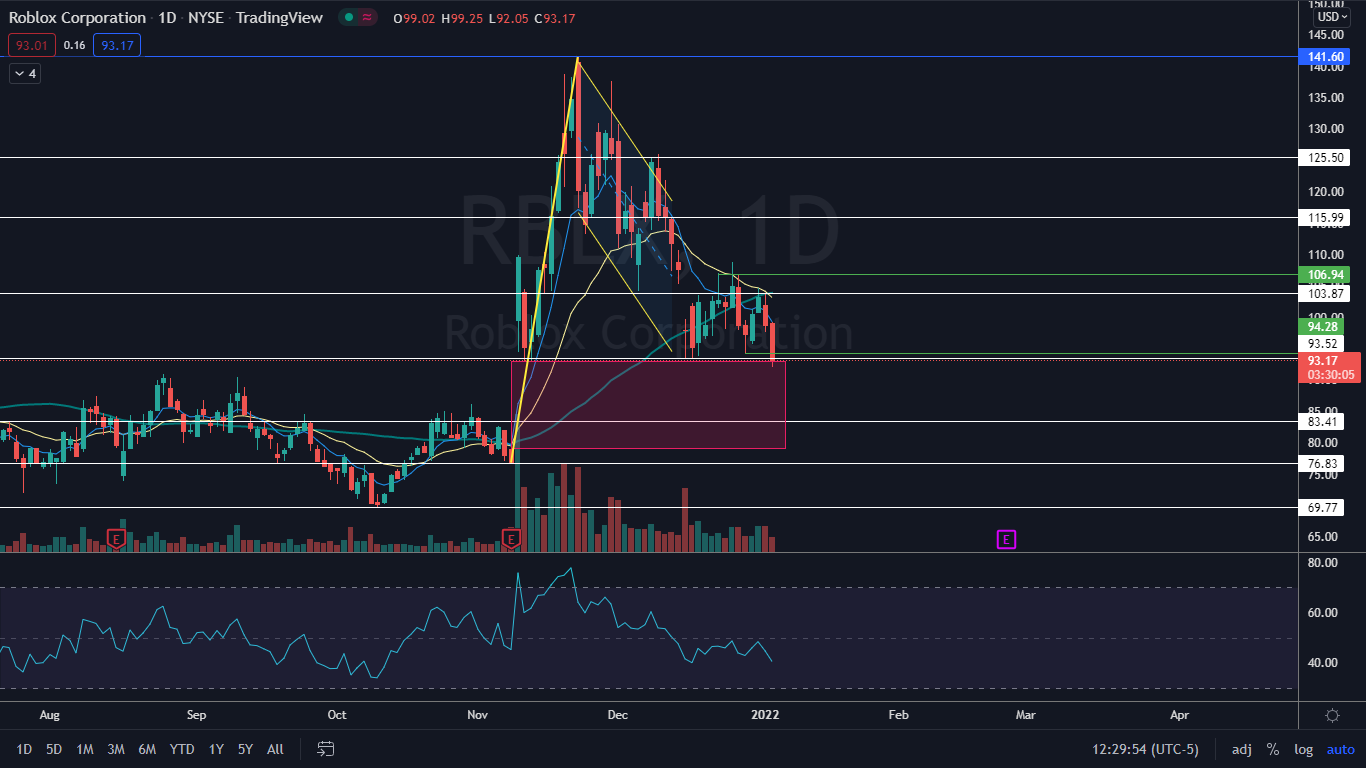
The Roblox Daily Chart: On Tuesday, Roblox confirmed its daily downtrend by printing a lower low below the Dec. 29 low-of-day at the $94.28 mark and by early afternoon was working to print a bearish Marubozu candlestick.
- The bearish Marubozu candle indicates lower prices may come again on Wednesday.
- There is a gap below on Roblox’s chart that the stock began to fill on Tuesday between $79.02 and $93.03. Gaps on charts fill about 90% of the time, so it is likely Roblox will trade down into the bottom of the range.
- If Roblox fills or mostly fills the gap, traders can watch for a reversal candlestick on the daily chart or for a confirmed trend change with a higher high and higher low to take a possible position.
- Roblox has resistance above at $93.52 and $103.87 and support below at $83.41 and $76.83.
(Click on image to enlarge)
The Roblox Weekly Chart: Roblox also confirmed on Tuesday it is trading in a weekly downtrend by printing a lower low below the Dec. 13 week low of $93.52.
© 2022 Benzinga.com. Benzinga does not provide investment advice. All rights reserved.


