
Why Meta Platforms Could Be Due For A Breakout Soon
Meta Platforms Inc. FB shares are trading higher Monday along with other mega-cap technology and internet stocks amid signs of strong demand for its Oculus virtual reality headset during the holiday season, Bloomberg reports.
Meta was up 3.31% at $346.35 Monday afternoon at publication.
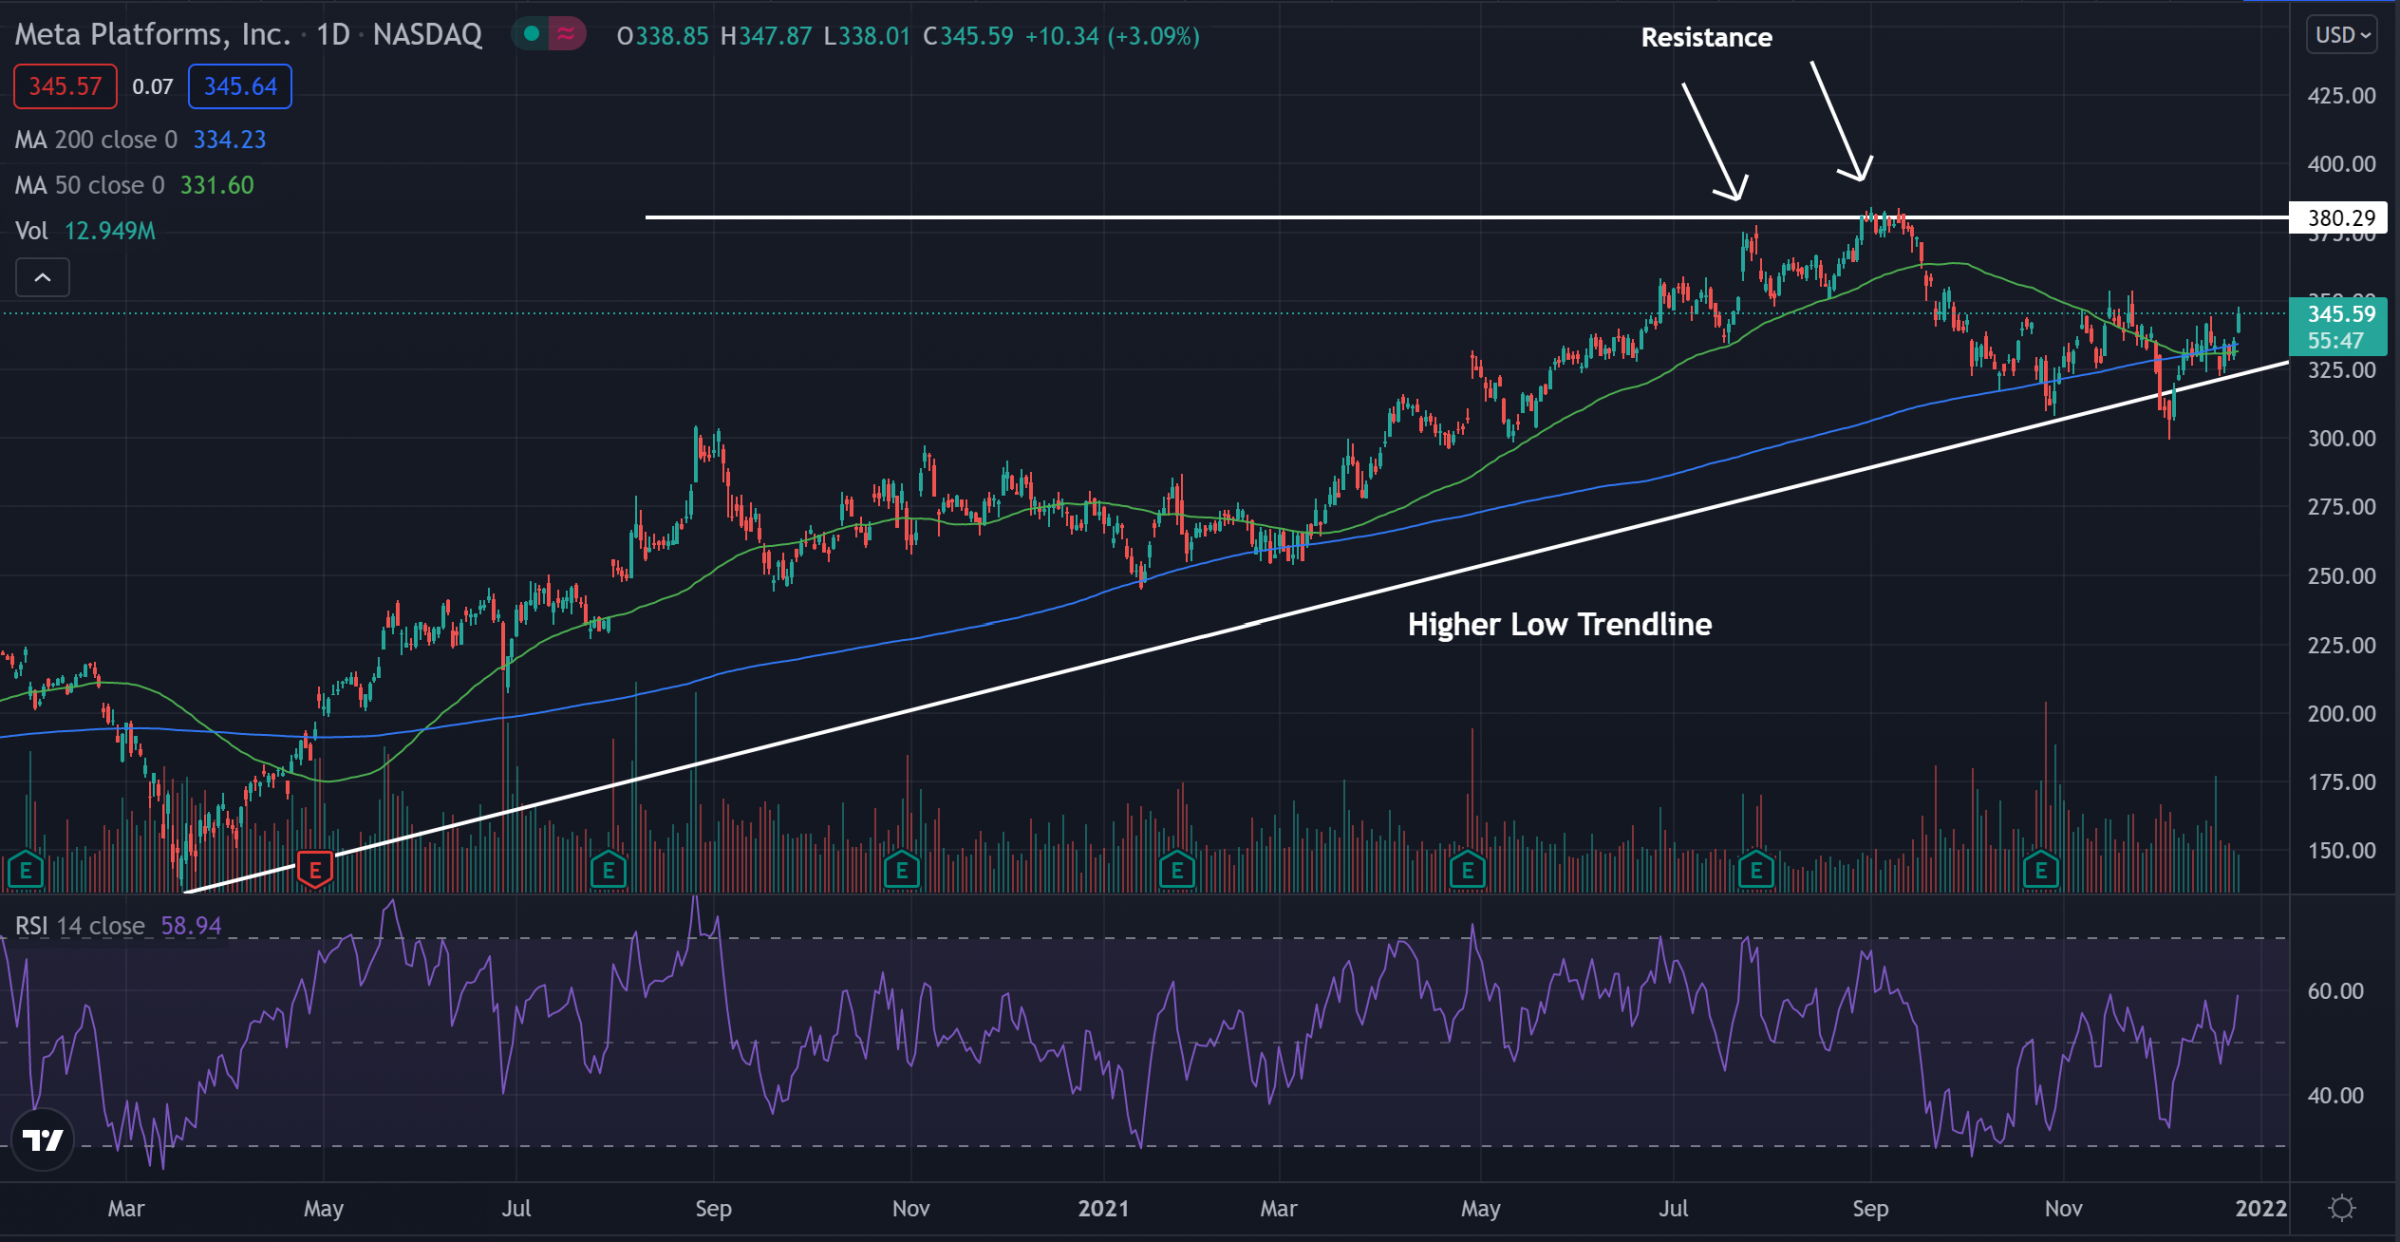
Meta Daily Chart Analysis
- Shares are trading in what traders call an ascending triangle pattern. The stock is nearing the end of the pattern and could see a strong bullish push if able to break above the $380 resistance level.
- The stock trades above both the 50-day moving average (green) and the 200-day moving average (blue). This indicates bullish sentiment and each of these moving averages may hold as an area of support in the future.
- The Relative Strength Index (RSI) has been slowly climbing for the past couple of months and now sits at 59 on the indicator. This shows an increase in the number of buyers in the stock and the overall selling pressure is being outweighed by the overall buying pressure.
(Click on image to enlarge)
What’s Next For Meta?
Meta shares have been trading within this pattern for a while and are nearing the end of the pattern. If the stock can continue to hold above the higher low trendline it could see a strong bullish push after crossing resistance. Bulls are looking for the cross of resistance with a period of consolidation above the level for the stock to continue higher. Bears are looking for a break below the higher low trendline for a possible bearish move and the start of a downward trend.
© 2021 Benzinga.com. Benzinga does not provide investment advice. All rights reserved.


