
On May 20, 2022, the market set up a bear trap pattern, and by the next week, the trap had sprung. Bears were caught by surprise and lost some money.
Let’s look at the market (meaning the S&P 500) and the thought process of the bearish traders to see how they got trapped.
We will use the SPY, which is the ETF, because that is the asset that can be bought and sold (unlike the SPX index).
The following is the end-of-day chart for May 19.
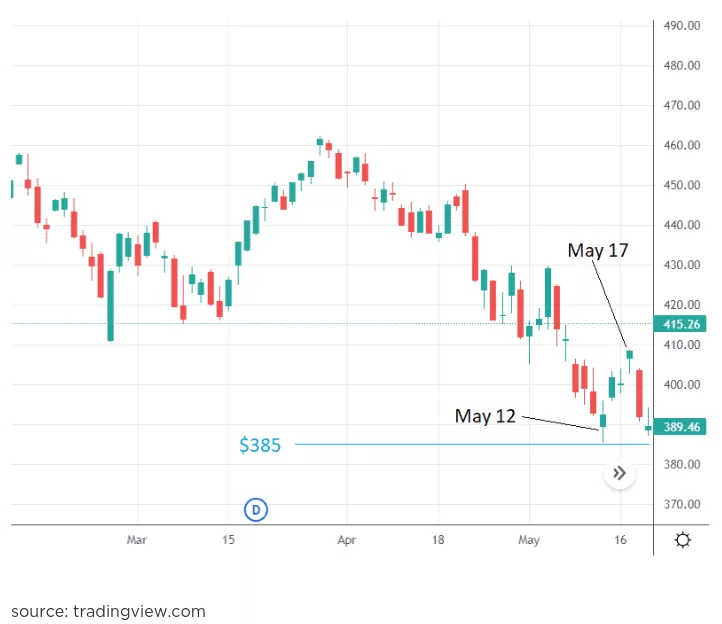
The market is in a downtrend.
So, the bears are on the right side of the trend and want to find an entry to go short in order to hop onto the trend. Price looks like it will re-test the low at $385 made on May 12th.
Bears are thinking, “Okay, if the price goes lower than the $385 support level, then I will go short”. This is the same concept as trading a breakout, except it is trading a break-down.
The next day on May 20, the bears sold shares of SPY or placed bearish option strategies when the price went below $385 at noon Eastern time.
Remember that they cannot see the completed candle with the bottoming tail yet.
All they saw on May 20 intraday was that prices were dropping fast, as shown in the 15-minute chart.
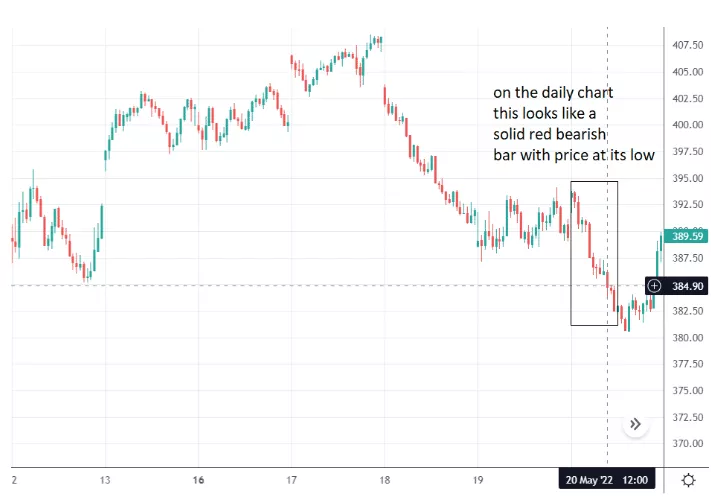
On the daily chart, the partially completed candle would have looked like a solid red bar with prices at its low.
They anticipate that price of SPY will continue down so that they can buy the shares of SPY at a lower price and make a profit.
When they buy back the shares they shorted, this is known as “covering the shorts” or “buying to cover.”
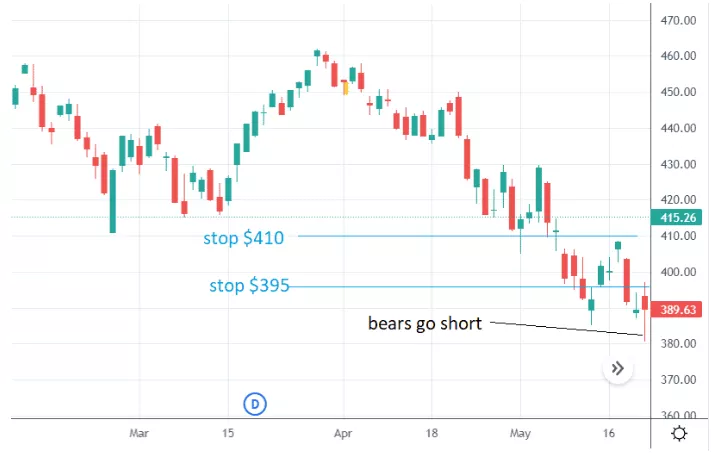
To protect themselves if they are wrong and prices go up instead of down, they placed buy-stop orders if the price goes too high.
The likely places where they would place these stops are at $395 (above the high of the May 19th candle) and at $410 (above the high of the May 17th candle).
It is not a bad plan. This was a reasonable play for the bears, and no one can blame them for it.
But the market was too devious and set up a trap to lure in the bears.
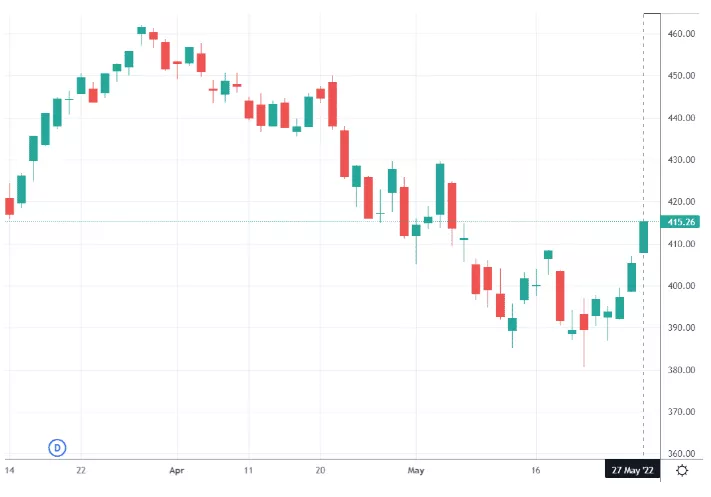
To the bears’ surprise, right after they placed their shorts, the market reversed and rallied higher in the afternoon, closing the day and closing the week near $390 on May 20th.
The P&L of the bears are now negative, but they are not too worried yet. Price did not hit their stops.
“Let’s see what next week will bring” is what they say, hoping there is a sell-off that will bring them back into profit.
The following week, the market went even higher, with Monday, Tuesday, Wednesday, and Friday all being green up-day candles.
This is bad news for the bears. Some of them exited their position at $395 when their stops were hit.
A lot of them exited at $410 — for a loss. Others closed their positions when they saw that their P&L was too negative to bear (pun intended).
This is known as a “short squeeze rally.” Price rallied up, and the bears have to “buy to cover.”
By buying, they helped prices go up further, which then triggers stops higher up, which causes longer-term bears to buy to cover, which causes prices to go up even higher. This will continue until all the bears that need to cover have already covered.
Most trend reversals do start with a short squeeze rally. But not all short squeeze rallies become trend reversals.
The rally could easily be a short-term counter-trend move before prices resume the trend downward.
Not All Bears Lost
I do not mean to imply that all the bears that were covering their shorts are at a loss.
Those bears that initiated a sell earlier when the price was up at $460 are buying to take profits when the price dropped to $385. These profitable bears are said to have entered a “good location.” The trapped bears that shorted below $385 are said to have entered at a “bad location.”
However, these terms are a bit of a misnomer because “good” or “bad” location is only determined after the fact.
At the time, all the bears thought they were entering at so called “good location.”
Conclusion
This is, in essence the pattern of a bear trap.
It is typically characterized by a bottoming tail candle (like May 20th), but it need not be. It can be a multi-bar formation (like what you saw in the 15-minute chart).
There are such things as bull traps as well but in reverse.
Bull traps and bear traps can be thought of as failed breakouts and breakdowns.
The bears entered the bear trap when the price broke support and is going to break lower.
But this breakdown pattern fails, and the price goes up instead.
Trapped.
Fun fact: May 20 was the day that the market dropped below 20% from its high on January 4th — although it did not “close” below 20% from its high.
The definition of a bear market is a 20% decline from its high.
So, the market is on the verge of its official bear market status, tantalizing the bears to go short.
Trade safe!
More By This Author:
The Best Behavioral Finance BooksOptions Trading 101: Unbalanced Condor – ADM Example
Calendar Spread Example: Apple Stock


Comments
Log in or sign up to join the conversation.