
Wells Fargo Just Reported The Worst Mortgage Number Since The Financial Crisis
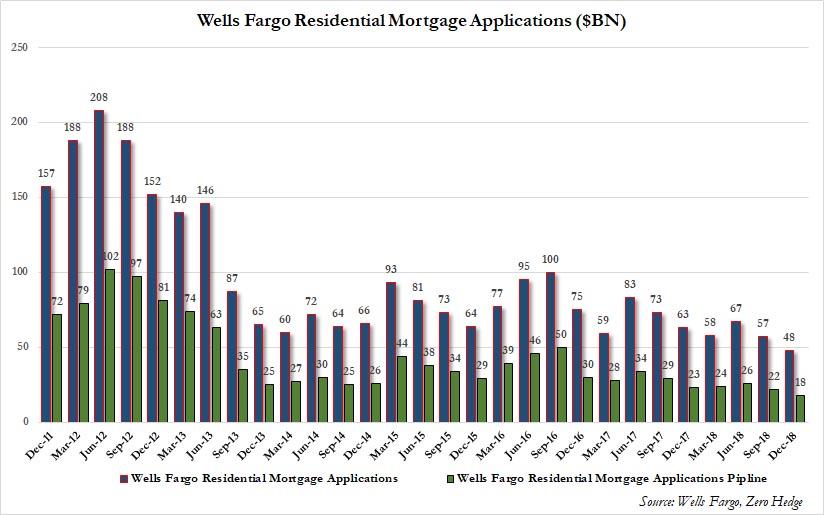
When we reported Wells Fargo's Q3 earnings back in October, we drew readers' attention to one specific line of business, the one we have repeatedly dubbed the bank's "bread and butter", namely mortgage lending, and which as we then reported was "the biggest alarm" because "as a result of rising rates, Wells' residential mortgage applications and pipelines both tumbled, sliding just shy of the post-crisis lows recorded in late 2013."
Well, unfortunately for Wells, despite the sharp drop in yields in Q4 which many had expected would boost mortgage lending or at least refi activity for the bank that was until recently America's largest mortgage lender, the decline in mortgage activity has continued,because buried deep in its presentation accompanying otherwise unremarkable Q4 results (modest EPS best; sizable revenue miss), Wells just reported that its 'bread and butter' is once again missing, and in Q4 2018 the amount in the all-important Wells Fargo Mortgage Application pipeline shrank again, dropping to $18 billion, the lowest level since the financial crisis.
(Click on image to enlarge)
Meanwhile, Wells' mortgage originations number, which usually trails the pipeline by 3-4 quarters, was just as bad, dropping a whopping $12BN sequentially from $46 billion to just $38 billion, and effectively tied for the lowest print since the financial crisis. Putting this number in context, just six years ago, when the US housing market was actually solid, Wells was originating 4 times as many mortgages, or about $120 billion.
(Click on image to enlarge)
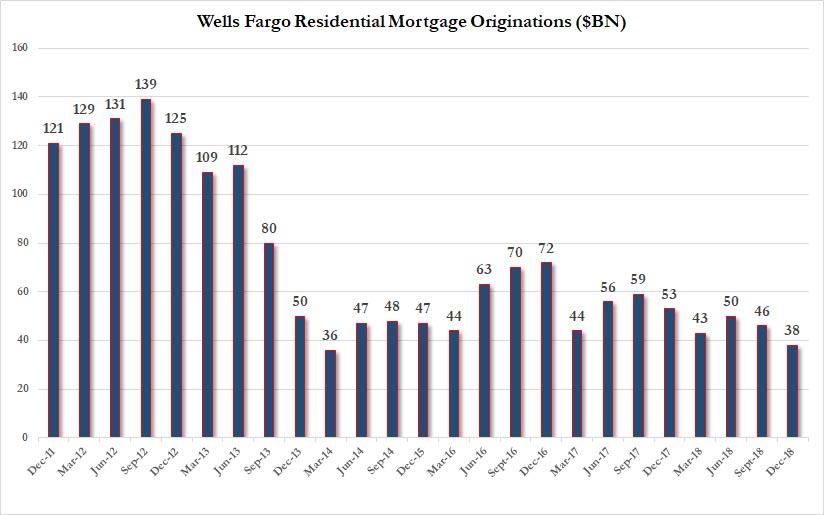
And since this number lags the mortgage applications, we expect it to continue posting fresh post-crisis lows in the coming quarter especially if rates resume their rise.
Going back to the headline numbers, here is a recap of the key metrics:
- 4Q adj. EPS $1.21, est. $1.19
- 4Q revenue $20.98 billion, Exp. $24.7BN
- 4Q net interest income $12.64 billion
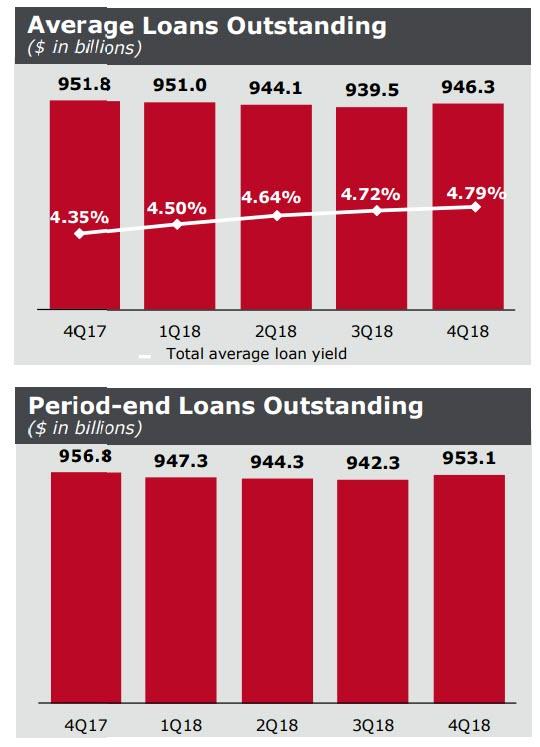
- 4Q loans $953.11 billion vs. $942.3 billion q/q
- 4Q mortgage non-interest income $467 million
- 4Q residential mortgage originations $38 billion
- 4Q margin on residential held-for-sale mortgage originations 0.89%
- 4Q non- performing assets $6.95 billion
- 4Q net charge-offs $721 million, estimate $736.8 million (BD)
- 4Q total avg. deposits $1.27 trillion
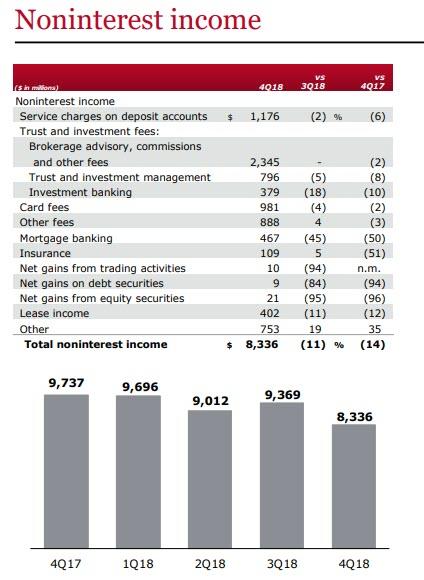
There was more bad news for Wells. First, as the chart below shows, Noninterest Income has been a disaster and is only getting worse with virtually every revenue category posting Y/Y declines.
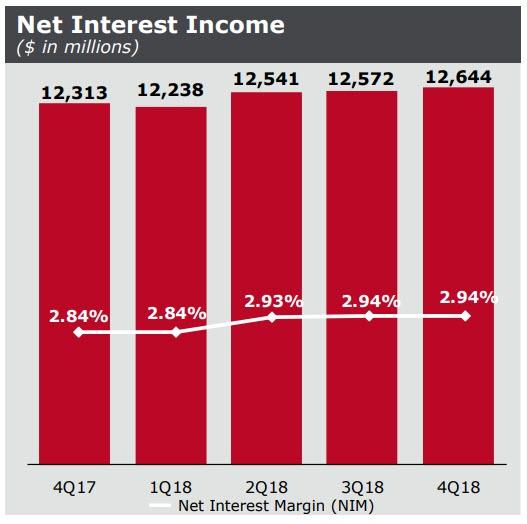
Things were not better on the interest income side where the bank's Net Interest Margin managed ended its recent streak of increases, and was unchanged at 2.94% resulting in $12.644 billion in Net Interest Income, and missing expectations of an increase to 2.95%. This is what Wells said: "NIM of 2.94% stable LQ as a benefit from higher interest rates and favorable hedge ineffectiveness accounting results were offset by the impacts of all other balance sheet mix and lower variable income."
There was another problem facing Buffett's favorite bank: while NIM failed to increase, deposits costs are rising fast, and in Q4, the bank was charged an average deposit cost of 0.55% on $914.3MM in interest-bearing deposits, double what its deposit costs were a year ago.
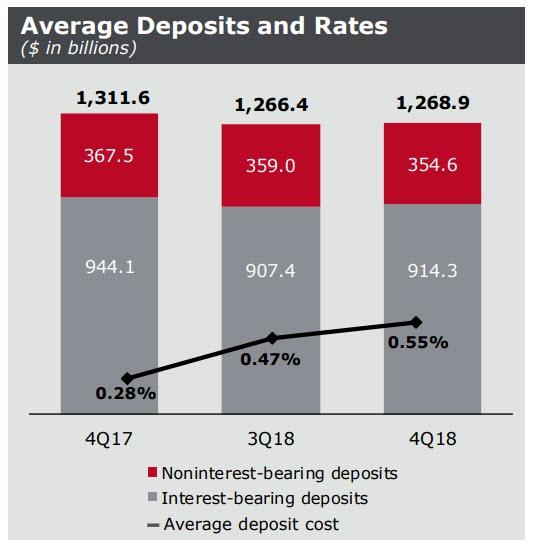
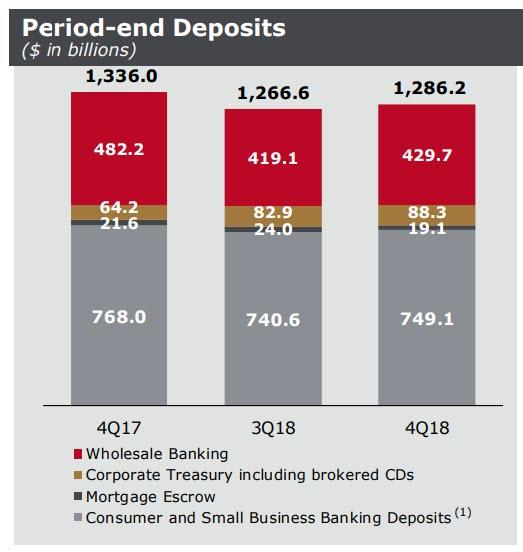
There was a silver lining however: amid concerns over the ongoing slide in the scandal-plagued bank's deposits, which declined 3% or $40.1BN in Q3 Y/Y (down $2.3BN Q/Q) to $1.27 trillion, in Q4 Wells finally succeeded in getting a modest increase in deposits, which rose to $1.286 trillion, if still down 4% Y/Y. This was driven by growth in Wealth & Investment Management deposits driven by higher retail brokerage sweep deposits, "partially reflecting a change in our customers’ risk appetite, as well as higher private
banking deposits." Offsetting this were declines in small business banking deposits, partially offset by growth in retail banking consumer deposits.
And some more good news: the recent ongoing shrinkage in the company's balance sheet appears to have finally reversed, because one quarter after average loans declined from $944.3BN to $939.5BN, the lowest in years, and down $12.8 billion YoY, average loans outstanding increased fractionally to $946.3BN, up $6.8BN, or 1% Q/Q. This rebound was entirely due to commercial loans , which were up $7.7 billion LQ on higher commercial & industrial loans. Meanwhile, consumer loans continued to decline, and were down $835 million LQ as growth in nonconforming first mortgage loans and credit card loans was more than offset by declines in legacy consumer real estate portfolios including Pick-a-Pay and junior lien mortgage loans due to run-off and sales, as well as lower auto loans.
And finally, there was the chart showing the bank's overall consumer loan trends: these reveal that the troubling broad decline in credit demand continues, as consumer loans were down a total of $13.7BN Y/Y across most product groups.
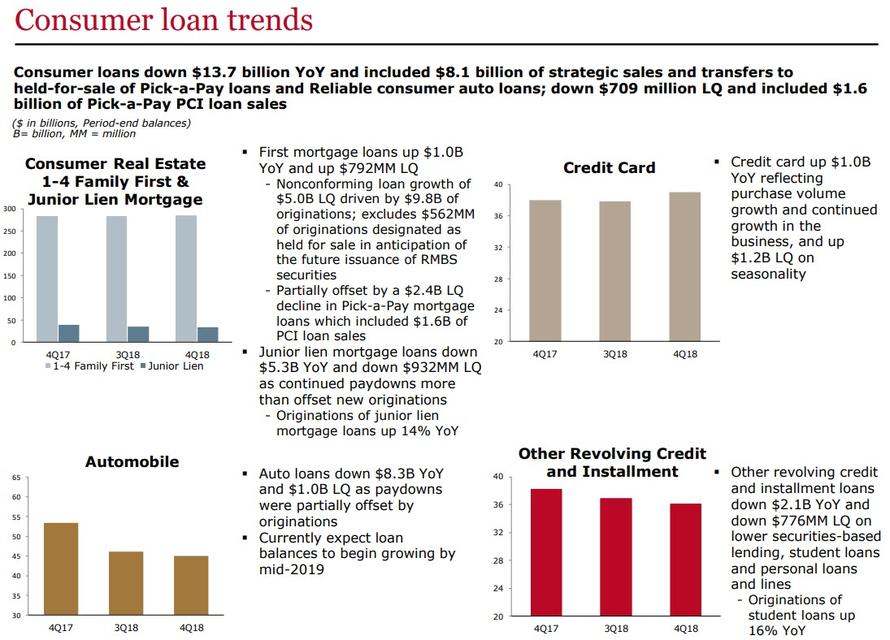
What these numbers reveal, is that the average US consumer can barely afford to take out a new mortgage even at a time when rates are once again sliding. It also means that if the Fed is truly intent in engineering a parallel shift in the curve of 2-3%, the US can kiss its domestic housing market goodbye.
Source: Wells Fargo Earnings Supplement
Disclosure: Copyright ©2009-2018 ZeroHedge.com/ABC Media, LTD; All Rights Reserved. Zero Hedge is intended for Mature Audiences. Familiarize yourself with our legal and use policies every time ...
more

