
Weekly Wrap: The Tale Of Two Cities Between Facebook And Amazon Earnings
The Week At A Glance
This was the busiest week in earnings season thus far with more than 225 companies reporting including 174 S&P 500 companies and 11 Dow Jones Industrial Average companies reporting. So far beats are exceeding long-term averages, but those that beat are getting rewarded less than usual and those that missed are getting hit hard… just ask Facebook.
Facebook’s earnings call was nothing less than a brutal faceplant, which led to shares losing the most of any company in US history in one day, while Amazon EPS was 2x estimates despite a modest revenue miss.
Housing data once again was brutally bad with every metric weaker than expected with the data over the past three months painting a clear picture of a sector that has rolled over.
The market’s tariff tremors were eased by the apparent progress to try and reach an agreement with the European Union, but no one seems to have noticed that French President Macron is not enthused.
The US has become a $20-trillion-dollar economy in the second quarter, the first for any nation, with Q2 growth at 4.1%. As expected, we saw a massive jump in the export of goods and in federal spending.
This week the Nasdaq broke out to new highs — that was before the Facebook (FB) faceplant. As the Nasdaq has gone on to make new highs, however, more and more stocks within the index have been falling below their 150-day moving averages, which shows this rise has been on poor breadth – meaning few stocks are pushing the index up.
The S&P 500 has yet to make a new high since its 2018 lows. There have been only three times during the current bull market where the S&P 500 did not make a new high in a 6+ month period. If it does not make a new high by August 10th, this will be the third-longest streak without a new high. The FAANG stocks [Facebook, Apple (AAPL), Netflix (NFLX), and Alphabet (GOOGL)] have been responsible for nearly half of the S&P 500’s gains in 2018, rising from 11.6% of market cap to 13.6% by Thursday’s close. We’re pretty sure that deadline will sail right on by given the market’s reaction to earnings from these folks last week and this week. Next week has Apple’s earnings report, but let’s remember the June quarter is the seasonally slowest one for the company.
Wednesday, equity markets accelerated up into the close on the news that the US and the European Union are working towards a series of agreements to avoid a trade war and reduce existing tariffs. So far this is great news, but the European Union is becoming an increasingly more complicated beast as the economic performance of the countries within it are diverging further. This likely means these agreements are unlikely to be achieved neither quickly nor smoothly.
Thursday we were once again reminded that Mr. Market hasn’t been acting terribly contemplative when French President Macron tossed out a, “Wait just one second there, buddy” on this grand sweeping tariff agreement proposed by President Trump and European Commission President Jean-Claude Juncker. Shut the front door. You mean sovereign nations may actually want to have a say in their own trade agreements? Like we said, great headlines, but implementation is going to be dicey and that European Union is dealing with some testy infighting these days, so the drama is just getting started.
As even a casual market watcher knows, trade has been a major topic so far this earnings season. Three major automakers saw their shares hit hard this week as Ford (F), General Motors (GM) and Fiat Chrysler (FCAU) scaled back their 2018 earnings forecasts in the face of rising raw material prices and unfavorable exchange rate moves. GM, the largest US automaker, said that rising commodity costs on top of moves in the Brazilian Real and Argentinian peso hit its bottom line to the tune of $1 billion. GM CFO Chuck Stevens told analysts on the earnings call that the company will pass along some of the increased costs due to the tariffs. Its shares lost over 8% despite having beat estimates.
Fiat Chrysler lost 16% thanks to a triple whammy of missing earnings, reducing guidance for the year and the tragic loss of legendary CEO Sergio Marchionne. June quarter earnings fell by almost 50%, and unsurprisingly after that hit, Fiat lowered its 2018 earnings projections, estimating that tariffs will reduce profits by about $600 million this year. Appliance maker Whirlpool (WHR) saw its shares fall by 14.5%, its worst one-day decline since 1987, after the company reported that higher steel costs under the new tariffs will materially impact its margins. Harley-Davidson (HOG), the company that kicked this all off several weeks ago, reported that yes, tariffs will cost the company between $45 and $55 million this year.
Regulatory changes took center stage when Facebook (FB) reported results that missed on revenue and global Daily Active Users (DAU) that led it to single day advise investors that its revenue growth rates will be slower than last year – particularly in the back half of 2018. Investors were clearly caught completely off-guard given the record high close just prior to reporting which highlighted the unreliable nature of partner checks. While overall DAUs were up 11% year-over-year, that was less than expected and growth was driven primarily from emerging markets as European DAUs declined, likely related to the General Data Protection Regulation (GPDR), and North American DAUs remained flat.
In after-hours trading on Wednesday shares of Facebook were down as much as 25% and closed Thursday down 19%, having experienced the single largest day loss in market capitalization of any company in US history. I’m thinking 2018 is not CEO Mark Zuckerberg’s favorite year no matter how much FB shares he’s sold in the last several months. Twitter’s (TWTR) results on Friday painted a picture of social media that is becoming less social as despite meeting earnings expectations, its number of monthly active users fell. Shares were down over 19% on the news.
The Economy
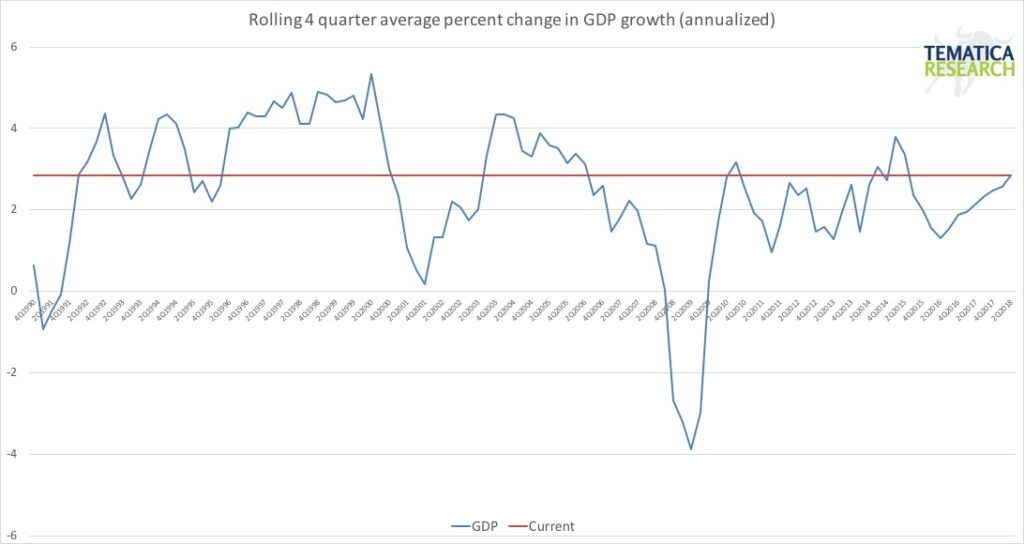
Friday, we learned that the first estimate for second quarter GDP is 4.1%. The chart below shows the rolling 4 quarter average GDP growth going back to 1990. Most recently, from the first quarter of 2015 through to the second quarter of 2016, GDP was slowing. Since the second quarter of 2016, it has been rising, but is still below the peaks of Q3 2019 and Q1 2015, sitting at 2.9% for Q2.
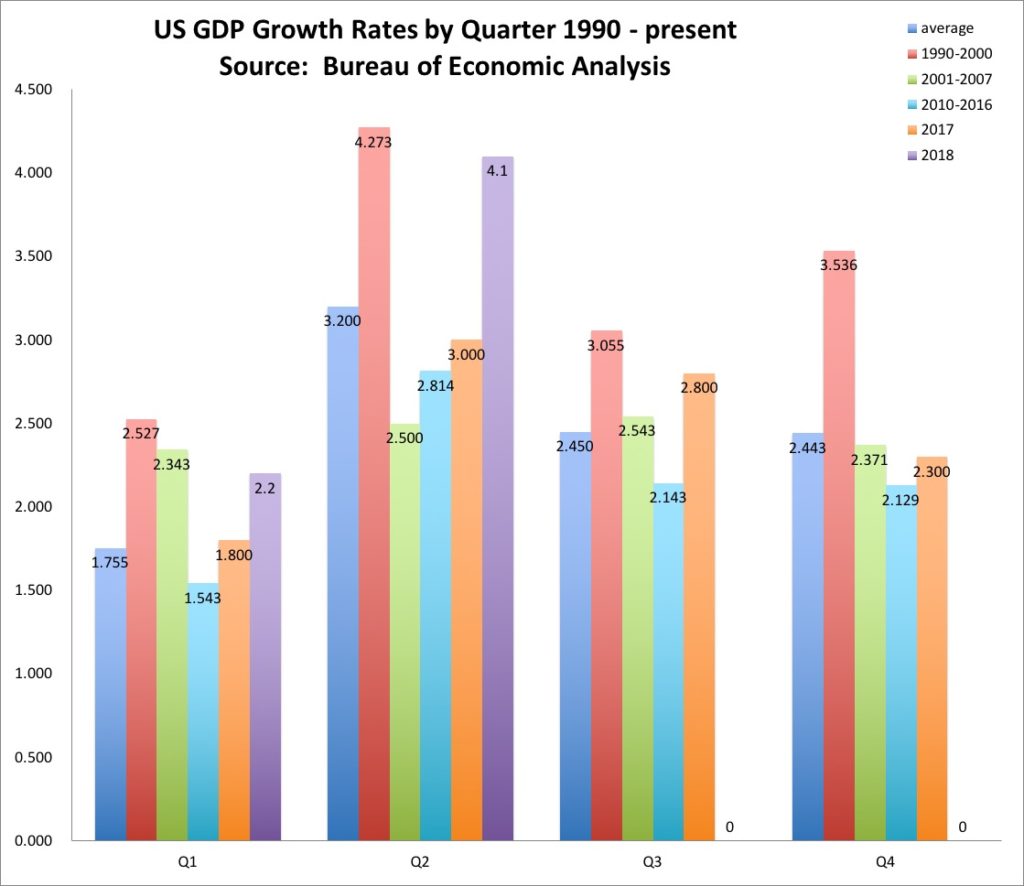
Looking at the historical trends in GDP by quarter, we can see that the second quarter typically is the strongest and that this quarter’s performance is just below the average for the 1990s but the strongest since Q3 2014.
Breaking down the component of GDP:
- Personal Consumption Expenditures were the highest since 2014 and 1.3x the average over the prior 16 quarters. This looks like a lagged impact from the tax cuts as the first quarter saw an increase of just 0.5%. I wouldn’t expect this to increase again so dramatically in the back half of 2018, particularly since this was driven in part by a decline in the savings rate.
- Gross Private Domestic Investment was actually a negative for GDP this quarter for the first time since 3Q 2016.
- Business Capital Spending was weaker than had been expected, with equipment purchases less than half of Q1 and two-fifths of the average rate in 2017 – so much for the enhanced depreciation and repatriation allowances from the tax cut. This was actually the weakest level since Q4 2016.
- The Non-Residential Structures component was the biggest contributor to GDP and was 12.4x the average of the prior 16 quarters.
- Exports were the highest since Q4 2013 and were 4.4x greater than the quarterly average over the prior 16 quarters. This was driven by a pull forward in demand to load up on imports from the US prior to the implementation of tariffs, which means we are likely to see weakness in the back half of 2018, (e.g. China and soybeans).
- Exports of Goods was the highest since Q4 2013 and were 5.5x the average over the prior 16 quarters.
- Federal Spending was also the highest since (take a wild guess here) … Q4 2013 and was 6.7x the average over the prior 16 quarters.
- Combining this data with what we are seeing from corporate earnings, and we see that earnings are rising at 4x the pace of GDP with corporate tax revenue the lowest share of GDP in 75 years.
- Residential Fixed Investment continues to be a drag on GDP and has been negative in 4 of the past 5 quarters.
Digging more into the details on housing, there’s no way to sugar coat it – it doesn’t look to be improving. The National Association of Realtors (NAR) Existing Home Sales Report delivered the third consecutive month of declines with sales weaker than expected at 5.38 million (Seasonally Adjusted Annual Rate – SAAR) versus forecasts looking for 5.44 million, driven by (as has been the norm during this business cycle) supply shortages which have driven prices out of reach for many. The NAR media price for existing home sales reached a new record high of 276,900 in June while at the same time mortgage rates have risen significantly – the typical rate on a 30-year fixed rate conforming mortgage has ranged from 3.8% to 4.8% over the past year. Between supply shortages and higher mortgage rates, affordability has hit a 10-year low and likely spells fewer homes for consumers trapped in our Middle-Class Squeeze investing theme.
New Home Sales fell 5.3% in June, to an 8-month low, and the prior two months were revised down as well. The number of new homes sitting vacant while for sale has risen by over 10% on a year-over-year basis which has pushed the unsold inventory backlog up to 5.7 months’ supply from 5.3 months in May – the highest level since last August.
According to CoreLogic, sales of both new and existing houses and condos fell 11.8% in Southern California in June, falling to the lowest level for the month in four years – for those of you not living in the sunshine state, this matters because home sales in California have a long track record of being a leading indicator for the nation. Sales of newly built homes were particularly weak, sitting 47% below the June average, likely due to unaffordability as the median price paid for all Southern California homes in June rose 7.3% year-over-year to a record high of $536,250. Our Middle-Class Squeeze investing theme was evident in the sales mix, with sales of homes below $500,000 declining 21% year-over-year while sales of homes over $1 million rose just under 1% – something we have been seeing throughout the country where homes at the higher end are seeing different dynamics than those for the lower and middle-income families.
On a positive note for housing, Black Knight’s mortgage analytics report this week revealed that delinquency and foreclosure rates were at new lows in June, with fewer than 2.4 million homes nationally in distress. We are in no way seeing anything like what we saw in the later part of the last business cycle with regard to the housing sector.
Home builder shares have been hit hard by the data in recent months, pushing share prices to the lowest levels since October with valuations at or near multi-year lows. Perhaps because of this data?
- Housing starts down – 39% annual rate
- Building permits down — 23% annual rate
- New home sales down — 22% annual rate with June the slowest pace in eight months
- University of Michigan July survey found the lowest percentage of Americans since 2008 think it is a good time to buy a home
The Richmond Fed reported this week, giving us now 3 of the 5 major regional manufacturing indices. Most of the readings for the three have been declining, with shipments, backlogs and employment particularly weak in July with outlook numbers also negative. On the positive side, the numbers are still at strong levels, but we don’t like the direction we are seeing – more evidence that we are in the later stage of this business cycle. Some of this could be attributed to concerns over trade and tariffs, especially following what was likely some pull forward in the June data. That ties with our next piece of data.
The Business Roundtable’s CEO Economic Outlook survey found that CEO confidence is on the decline, with the survey index declining for the first time in almost two years in the second quarter with the largest quarter-to-quarter decline in three years. Of the CEOs questioned, 95% were concerned that foreign trade retaliation may lead to lower US exports and 91% worry about the impact of higher import costs on consumers. Within the index, sales expectations fell -11.6% and capital spending intentions fell -7.8%. Here we have a confirming data point to what we are seeing from the Fed regional manufacturing indices – concern that the coming months may not be a rosy as investors expect.
The Bottom Line for the Week
While GDP growth for the second quarter did come in strong, the major drivers of that growth are not likely to be repeated at those levels in the back half of 2018. The lack of business capital spending tells us that the C suite isn’t overly enthusiastic about their growth prospects, regardless of what any sentiment survey may indicate. The share price changes in response to earnings results attests to our assertion that stocks have been priced for perfection.
Next week we will be looking at data releases on Personal Income, Consumer Spending, ADP Employment, Nonfarm payrolls, Average Hourly Earnings and Consumer Confidence. On the housing side we’ll get the Case-Shiller home price index. For the corporate side of things, we’ll be looking at the Chicago PMI, Core Inflation, Markit Manufacturing PMI, ISM Manufacturing Index, Factory Orders and Motor Vehicle Sales. All that as well as earnings from Apple, Cummins (CMI), Honda Motor (HMC), Lumber Liquidators (LL), Square (SQ), Insulet (PODD) and several hundred others.
Disclosure: None.


